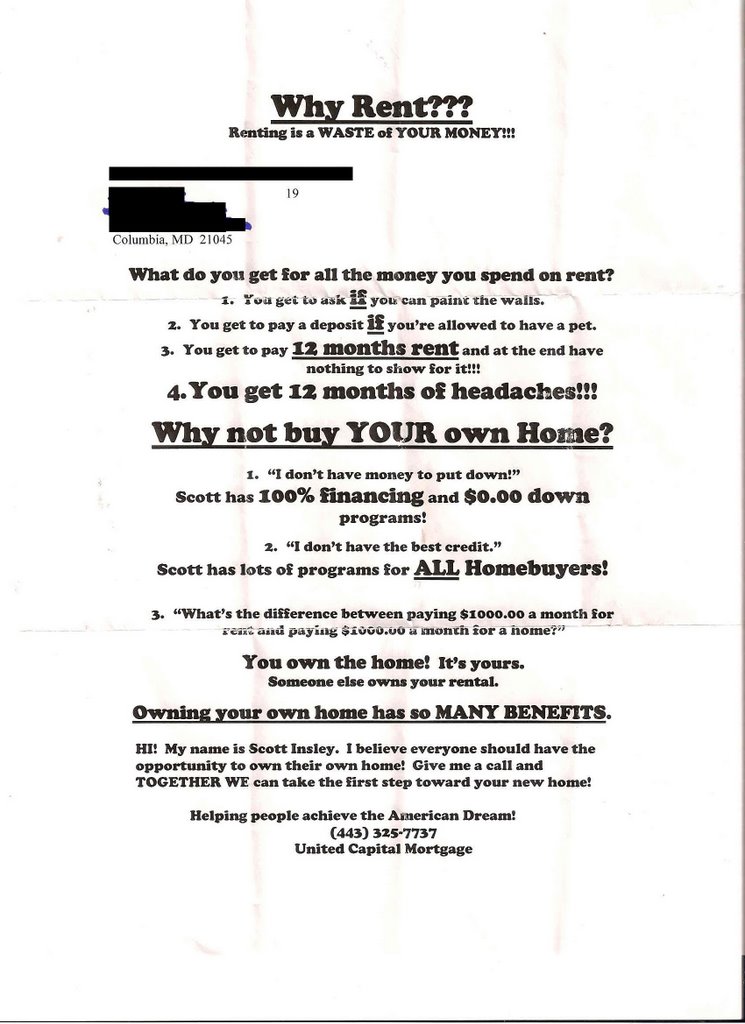
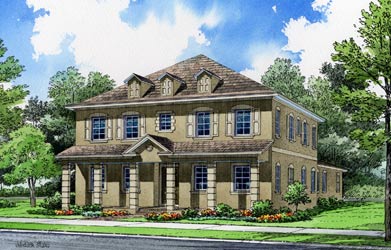
 Deceptive Flyer from Mortgage Broker
(click on image for larger version)
Deceptive Flyer from Mortgage BrokerChicago-area sales of existing homes and condos fell 14.5 percent in July compared to the same month last year, but median prices rose 2.6 percent, according to the Illinois Association of Realtors.
Nevertheless, single-family home sales in the Chicago area fell by 18.6 percent in July compared to last year at this time.
Even with the Chicago-area single-family home sales falling, median prices rose 4.2 percent, to $285,000. (Daily Herald 8/24/06)
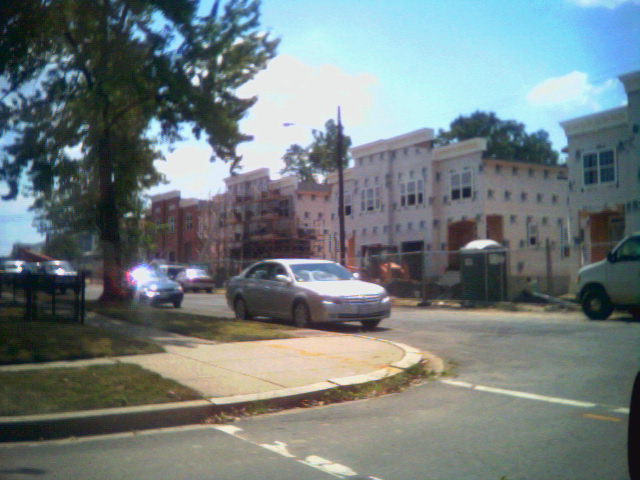
 View from Congress Street in Washington, DC of Senate Square condo development.
Prices:
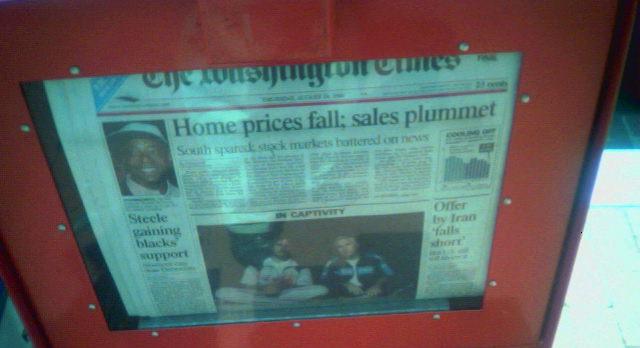
Newpaper box in Washington, DC
Washington Times headline 'Home prices fall; sales plummet'
 How about those construction cranes building condos in the Miami area?
The figure was weaker than the average Wall Street estimate of a pace of 1.105 million units. The level of new home sales was down 21.6% from the pace a year earlier, when many analysts had warned about a property market bubble.More bad news for the 'soft landing' cheerleaders. The 'soft landing' theory is being put to rest. Soon the argument will merely be how hard will the landing be.
The average sales price fell to $230,000 from $233,800 in June. It has been falling since a peak of $257,000 in April [corrected] but is virtually unchanged from the level a year ago of $229,200. (RTE Business)

 The median sales price has risen 0.9% in the past year to $230,000. It matches June for the weakest price growth in 11 years. Prices fell on a year-over-year basis in the West and the Northeast.
The media regulary turns to him for real estate quotes. He is very influential. David Lereah needs to be discredited by the mainstream media. Mr. Lereah tells half truths and manipulates facts and figures. He cannot be trusted as he is a paid shill. David Lereah is the new 'Baghdad Bob.'"With more sellers competing for the pool of buyers, the pressure on home prices has evaporated in most metro areas. After a full year of double-digit gains in the national median price, the timing is right for a cooling in the rate of growth -- we are presently experiencing a soft landing in the housing sector."
 New duplex housing coming along the 4900 block of 7th Street NE in Washington, DC
The local housing market will experience a price decline of 5% only under extreme unlikely scenarios. For example, mortgage rates rising to 7.8% in combination with 25,000 job losses could lead to a price decline.However, according to data from DataQuick:
The new survey shows that median sales prices for new and resale homes and condominiums in Sacramento County fell 5 percent below July 2005 levels.According to Freddie Mac interest rates on 30yr fixed averaged 6.52 . Jobs are still plentiful in Sacramento as it "showed strong growth in online want ads." [Monster.com] The 'extremely unlikely scenario' where mortgage rates hit 7.8% in conjunction with 25,000 job losses in Sacramento area has not yet happened. Yet, median prices have already declined 5% (YoY) in Sacramento county.
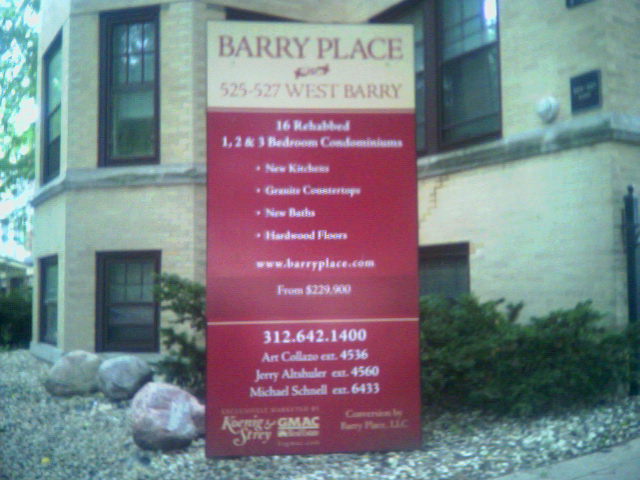
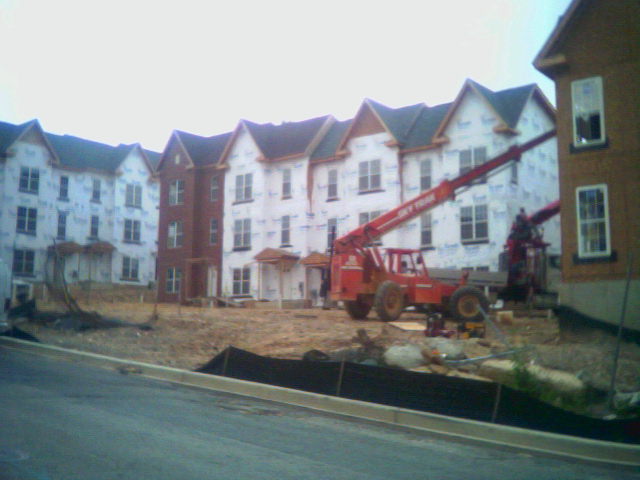
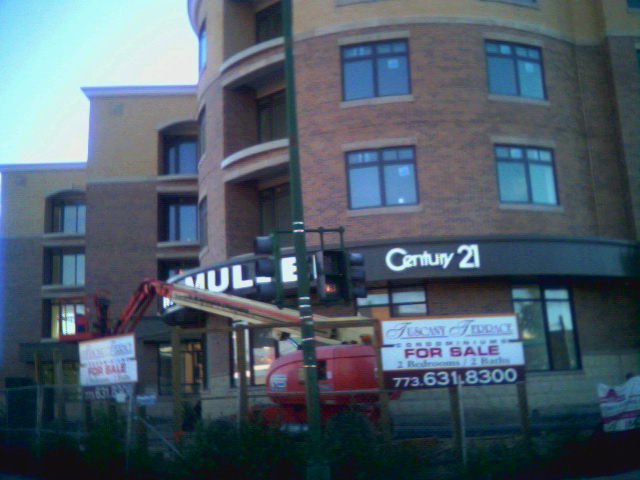 New condo building under construction in Chicago area that will also house a Century 21 Realty Office on the first floor.
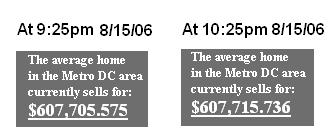 The counter continues to show rising prices. If you click on the price it takes you to a webpage where it states:
That is the average estimated sale price of a home in the DC Metro / Northern Virginia area!
According to the Northern Virginia Association of Realtors (NVAR):
"Average sales prices continued to rise through December [2005] in Northern Virginia, despite a decrease in sales and sizeable increase in inventory. The average sales price [in Northern Virginia] rose to $552,621, a 16% increase over December 2004's average of $476,941."A 16% rise in home prices annually means a 1.3% rise monthly. This translates to a rise of $239.47 increase in value daily, or $9.97 per hour!
Become a home owner and have this $9.97/hour work for you, instead of against you!
Every hour you wait is costing you $9.97 in equity!
The counter is a lie for multiple reasons. Here are some reasons:
My Response: I am glad you have indeed removed the price counter from your front page. It is still on other webpages as of 12:15am 8/16/06. The price counter must be removed from all webpages. You still owe a public apologize for keeping the price counter up for so long. You are obviously very aware of it being there because the company has a very savy website, including a blog. The fact that you were able to repond to my post within 30 minutes of it being posted speaks to the sophistication of your web operation. I demand a full apology and a commitment to represent reality when dealing with clients. If the price counter is not removed by 5:30pm on 8/17/06 EST, I will be using my contacts at the local media to report DROdio Real Estate Inc. and will also file a complaint with the Better Business Bureau.
David,
I agree with you in that the figures are outdated. I've removed them from our site.
I'm very sorry to see such a negative posting. You should just realize that we're a very hard working group of people trying our best to fairly represent clients and their interests. Using words like "lies, deception and scare tactics" to describe us is not at all a fair representation, and marginalizes the many, many satisfied customers we have, and the years of work I have put into building our company. I hope you reconsider your position.
Regards,
DROdio
Owner & Managing Broker, DROdio Real Estate, Inc.
The association'’s second-quarter metro area single-family home price report, covering changes in 151 metropolitan statistical areas,* shows 37 areas with double-digit annual increases and 26 metros experiencing generally minor price declines - many of the areas with declines are showing weakness in the local labor market.In real dollars the 3.7% nominal increase in represents basically flat median prices. Regionally, median sales prices of existing homes increased 3.6% in the Northeast, 4.1% in the South, 3.6% in the West and fell 2.0% in the Midwest.
The national median existing single-family home price was $227,500 in the second quarter, up 3.7 percent from a year earlier when the median price was $219,400.
Metro area condominium and cooperative prices, covering changes in 57 markets, show the national median existing condo price was $225,800 in the second quarter, down 0.3 percent from a year earlier. Fifteen metros showed double-digit annual gains in the median condo price, and 14 areas had declines.


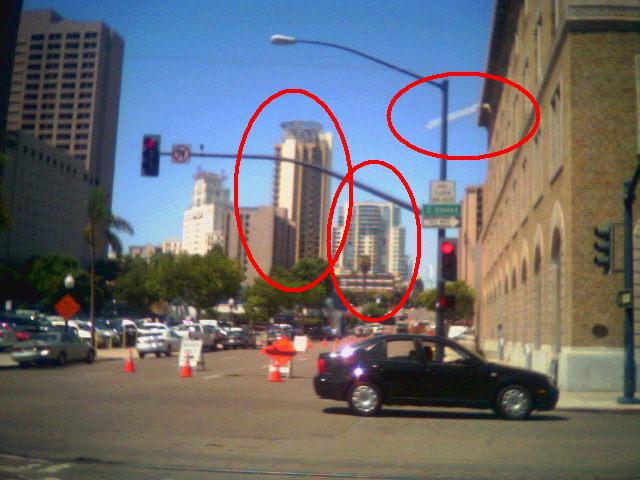 Two large new condo buildings,
 New condos in downtown San Diego
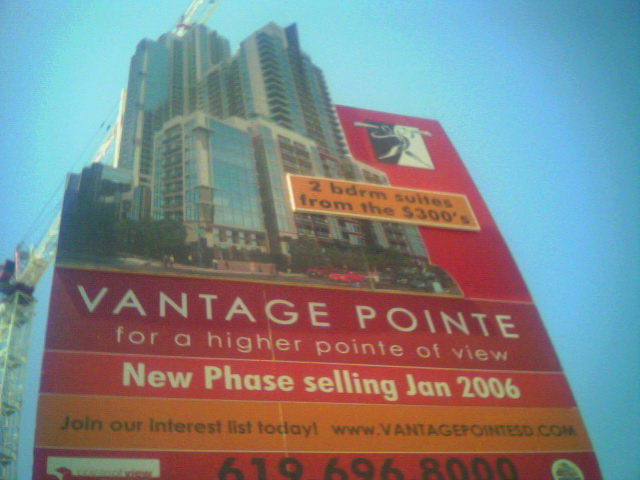 Condos that are under constructed being offered for sale
Washington, DC (just the District of Columbia, no suburbs)
Prince George's County, MD
Montgomery County, MD
Loudoun County, VA
"Real estate is probably the best investment any young person can make," says Yadiris Ferreira, 29, who bought a condo last month in Pembroke Pines, Fla.
Still, her mortgage, including homeowner association fees, totals $1,800 a month — more than half the money she takes home as a high school math teacher. "It's crazy," Ferreira concedes.
But, she explains, "If I didn't buy something soon, it was going to get to the point that I couldn't afford anything."

Renting is so 6 months ago. [Give your landlord the boot] Renters become homeowners with no painful crack of the wallet. For about 1,508.46* a month you could be living it up in your own downtown digs. We're talking slate flooring and granite countertops...We all know condos won't sell unless they have the obligatory granite. It must be better then sliced bread. Here are the payment details for 1,508.46:
* Based on a purchase price of 425,700.00 . First mortgage loan amount of 340,550.00; 480 month term pay option loan with a minimum payment rate of 1.475%. Minimum monthly of 939.66. APR 5.884% with a lifetime cap of 10.05% Fully indexed interest rate will be based on the 12 Month Treasury Average plus a margin of 2.55%. Second mortgage based on 42,500.00 Line of Credit at 7.75%, interest only payment of 274.80, 7.98 APR%. Scenario reflects 10% down payment HOA fees of 294.00 per month included. Above monthly payment does not
include property taxes of approx. 443.44 per month. .....
"America is officially into a buyer's market, so (there is) no reason to sit on the sidelines and wait for a price drop," Riggins said. "Just like home builders are offering incentives, more and more sellers are offering incentives such as holding the note, paying down the interest rate or assisting with closing."So is it a good time to buy in the bubble markets?
Right on. The economic 'recovery' coming out of the 2001 recession was built on an mountain of debt. So what happens next?This bubble sustained the economy through the 2001 recession and provided the basis for the recovery. The housing sector directly employs more than 6 million people in construction, mortgage issuance and real estate. The indirect effect of the bubble was even larger, as people took advantage of the rapidly growing value of their homes to borrow huge amounts of money. This borrowing binge supported rapid consumption growth in a period of weak wage and job growth. It also pushed the U.S. savings rate into negative territory for the first time since the beginning of the great depression.
So what effect will the housing bubble have on the genereal economy. So is a recession is coming?But, it was inevitable that the bubble would eventually collapse. The record run-up in housing prices led to record rates of housing construction. With population growth slowing, the country was building homes far more rapidly than the market could absorb them. At some point, excess supply will put downward pressure on prices.
The weakening of the housing market was further assisted by an entirely predictable rise in mortgage interest rates. The Federal Reserve Board deliberately pursued a low interest policy to help the economy recover from the stock crash, pushing interest rates to their lowest level in 50 years. With inflation picking up steam due to the oil price spike, higher import prices, weaker productivity growth, and a stronger labor market, interest rates are rising back to more normal levels.
The decline in housing prices will sharply limit the extent to which people can borrow against their home to support their consumption. This will cause savings to rebound from their current negative rates to more normal levels—at 6 to 8 percent of disposable income—but will be associated with a sharp falloff in consumption.
Together these effects virtually guarantee a recession, and probably a rather severe recession. Even worse, there is no easy route to recovery from a recession that results from a collapse of a housing bubble, just as there was no easy route to recover from the stock crash induced recession of 2001. Greenspan used the housing bubble to recover from that crash, because he saw no other mechanism. Unless Bernanke can find some other bubble to inflate, the recovery may be a long slow process. It took Japan almost 15 years to recover from the crash of its stock and housing bubbles.
The crash and post-crash world will not be pretty. Millions of people will lose their jobs and their homes. Unfortunately, the economists who led us down this path are not likely to be among the ones who suffer severe consequences.
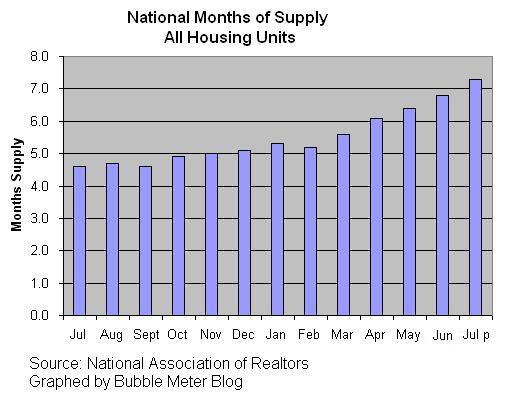
The Mortgage Bankers Association (MBA) today released its Weekly Mortgage Applications Survey for the week ending July 28. The Market Composite Index, a measure of mortgage loan application volume, was 527.6, a decrease of 1.2 percent on a seasonally adjusted basis from 533.8 one week earlier. This is the lowest that the index has been since May 2002. On an unadjusted basis, the Index decreased 1.4 percent compared with the previous week but was down 29.0 percent compared with the same week one year earlier.Calculated Risk has a superb post with great graphs. Obviously, this is more evidence of the significant declines occuring in the housing market.
The refinance share of mortgage activity increased to 37.0 percent of total applications from 35.6 percent the previous week. The adjustable-rate mortgage (ARM) share of activity decreased to 27.8 percent of total applications from 28.6 percent the previous week. The ARM share is at its lowest since March 2004.
Shortly, both DC Housing News and The Boy in the Big Housing Boy Bubble will be removed from my blogroll. :-( Out At The Peak is on the watchlist.
Ok. Now the good news. :-) Here are some recent solid additions to the BubbleSphere:
Stay strong! Oh BubbleSphere! We will continue shining light on this speculative episode. Collectively, the bubblesphere is a powerful source of information that is being read by tens of thousands of people each and every day.
The Daily Reckoning is a an excellent read. Currently, they are very bearish.
"I sing of ARMs and the Man..."
-
Virgil's Aeneid
We don't really have that much more to sing about ARMs, dear readers, but we just couldn't resist the headline.
Still, now that we think about it, our cautionary tale is likely to end just as bloodily as any epic poem we've read. Imagine what would happen if mortgages were adjusted upwards to rates anywhere near 10% - or any where near where they were 25 years ago?
That is why the Bernanke Fed cannot really fight inflation or stagflation the way Paul Volcker once did. Too many homeowners wouldn't be able to afford it. ARMS were meant to give marginal borrowers flexibility. Instead, they have locked both the borrowers and the Fed itselfinto...well, leg-irons. The borrowers have no margin. Most cannot affordeven the slightest boost in their payments. And with such boosts now automatic, the Fed can only react to inflation threats by prevaricating.
According to David Rosenberg at Merrill, discretionary items are now rising at a 5% annual rate - far beyond Ben Bernanke's target. But what can he do?
ARMs were supposed to be a way to realize the American dream of homeownership. But, like much else in American life, that dream too has been hollowed out.


