Tuesday, February 28, 2006
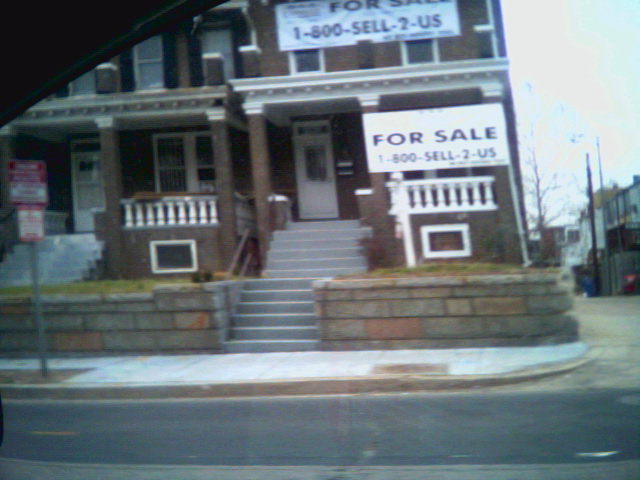
A Real Estate P/E Ratio for Washington DC
A special thanks to Eric in DC who wrote this article:
Many of us are familiar with the idea of a P/E ratio for a stock. This is the ratio that shows us how much we are paying for each $1 of earnings of a company. As an example, GE is trading at $33.20 with a P/E ratio of 21.70. This means that you are paying $21.70 for every dollar in earnings that GE makes. The P/E ratio has been a traditional indicator for when to buy a stock. The lower the P/E the better is the logic here.
Many people who invest in real estate have a similar idea with a Real Estate P/E Ratio. An RE P/E ratio is determined by taking the price of your home and dividing it by what it would rent for. Now obviously you can’t just take the actual price of your home and divide it by the monthly rent. What you normally do is take the total monthly carrying cost of a property and come up with a monthly total of ownership. (20% down payment, 30 yr mortgage, taxes, and insurance) Then you can divide this number by what you can rent the property for monthly. A simple example would be a 1 bedroom condo that costs $100,000. You put 20% down. And the total monthly payment would be somewhere in the neighborhood of $1,000 per month. (Mortgage, Tax, Insurance around $750 and Condo fee of $250) (In 2000 I owned a condo and this was my approximate payment). This 1 bedroom would have rented for about $1200 per month at the time. So the P/E ratio would have been $1,000/$1,200 = 0.833. Let’s look at this same 1 bedroom in today’s market. The price now is $300,000. 20% down is $60,000. Finance $240,000 for 30 years at 5.75% = $1,400.57 per month, plus taxes, insurance, condo fees = $1,800 per month. (I’m being generous here. It would actually cost more then this.) This condo would rent for approximately $1,400 per month now (Check for 1 bedrooms in Glover Park, DC). So the P/E would be $1,800/$1,400 = 1.286. Notice that the lower the number the better. If the number is above 1 you are in the negative. If it is below 1 you will make some positive cash flow on the investment.
My next goal was to come up with a way to track the real estate P/E ratio for the DC metro area as a whole. This would give me an idea of when the market made sense to invest. That is how I came to this RE P/E DC Ratio. The price is the Office of Federal Housing Enterprise Oversight House Price Index. (http://www.ofheo.gov/media/pdf/hpimsa_05q3.xls). They have broken out housing prices by the metropolitan areas from the census. For DC they go back to Q3 1975. This number is an index number that started at 100 in Q1 1995. The earnings number comes from the CPI. (http://www.bls.gov/data/home.htm)
The Bureau of Labor Statistics keeps consumer price index information for metropolitan areas as well. One number they keep is called the “Owners' equivalent rent of primary residence”. They started this for DC in Dec 1997 at 100. The Owners’ equivalent rent of primary residence is a unit of the CPI (representing 20% of the total CPI) that tracks how much houses would cost to rent. It represents the best number that we have to give us a solid basis for how much rents are in an area.
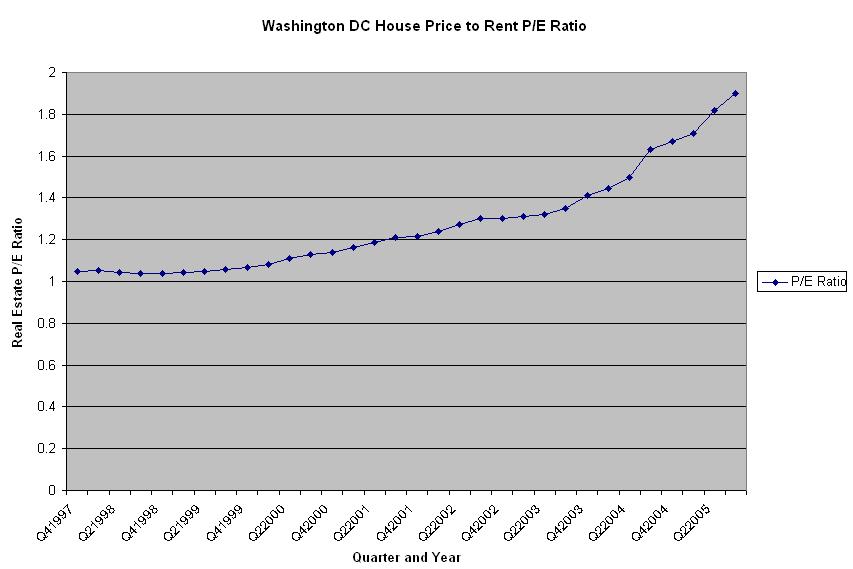
We can use the DC RE P/E Ratio to give us an idea of how overall prices and rents are interacting within the DC metro area market. This dramatic increase in P/E means that housing prices have been increasing much faster then rents. It seems that now would be a very bad time to buy an investment property. We will have to wait until either condo prices drop or rents rise significantly in order to be able to get a better (or any) return on our investment.
Monday, February 27, 2006
Aerial Mapping Article
The NAR has an article about aerial mapping. Check it out as it is worth the read. Here is an excerpt:
"One drawback of moving towards aerial real estate mapping in online listings is that you get the good along with the bad. Aerial mapping not only showcases the good features of the property and surrounding neighborhoods, they also can bring to light some negative factors that may turn off potential buyers. You can't hide the location of a hazardous waste site or erase the existence of power lines or cellular towers in aerial real estate maps."
Oh no. The buyer may actually have more infomation and see the bad. Oh the tragedy! I can just hear it now "I just lost another sale to the information super highway." (like the ditech.com commercial)
BubbleSphere Roundup
Seattle Bubble has a post titled 'Mobile Homes Disappearing In Seattle's Bubble.'
At Crash 2006 there is a interesting piece about the Boston Condo market. "The condo market in Boston is ready for a crash. Currently, condo listings are the highest for six years. Nervous developers are offering a range of incentives" Check it out.
Its tax season, and Bankrate has a article about Tax consequences for flipping real estate.
The New York Housing Blog has not been updated since November 22, 2005. I will be removing the link soon. Ah maybe it was another case of blogger fatigue.
In the past few weeks the bubble sphere has grown with more regional sites popping up. Excuse lousy pun. They include the Sonoma Bubble and the South Florida Bubble. If you know any more please email me and let me know. I want to add them to links section. It would be great if there were more regional housing bubble blogs from Phoenix, Las Vegas, and other bubblicious cities.
Finally, Out at the Peak talks about how "I can no longer keep up with all the bubble news and comments" because "there is just too much information going on in thriving blogs and their comments." However, the blogger states its a "great thing." Well said. :-)
Sunday, February 26, 2006
Update III: 1228 Walter Street SE
The rowhouse located at 1228 Walter Street SE sold at 517K. This was less then the last asking price of 529K.
Previous Posts:
1228 Walter St SE (Dec 11)
UPDATE: 1228 Walter St SE (Dec 30)
Update II: 1228 Walter Street SE (Feb 8)
You can go to Joe's real estate website and see properties that have recently sold:

On Joe's webpage it says the 'original price' was 529K. However, that was not original price, but merely the most recently listed price. The original price was 549K. Joe should change the wording from 'original price' to 'last asking price' or change the amount from 529,000 to 549,000. Currently, it is misleading.
Update V: 8300 Hartford Ave
The house located at 8300 Hartford Ave in Silver Spring, MD is now under contract.
See Previous Posts:
Update: 8300 Hartford (Jan 11)
8300 Hartford Avenue (Dec 12)
Falling Leaves, Falling Prices II (Nov 13)
8300 Hartford Avenue, Silver Spring, MD (Oct 9)
What did is sell for?
See Previous Posts:
Update: 8300 Hartford (Jan 11)
8300 Hartford Avenue (Dec 12)
Falling Leaves, Falling Prices II (Nov 13)
8300 Hartford Avenue, Silver Spring, MD (Oct 9)
What did is sell for?
Update: 1221 C ST SE
The cute small rowhouse located at 1221 C Street SE is still listed at 525K.
Original Post (Feb 6)
Craigslist Posting (Feb 26)
In the Craigslist posting it screams " YOU MAY HAVE SEEN THIS HOME BEFORE, BUT YOU MUST SEE IT NOW FURNISHED AS A MODEL!! "
It is also supposedly the "BEST VALUE ON CAPITOL HILL!!"
Original Post (Feb 6)
Craigslist Posting (Feb 26)
In the Craigslist posting it screams " YOU MAY HAVE SEEN THIS HOME BEFORE, BUT YOU MUST SEE IT NOW FURNISHED AS A MODEL!! "
It is also supposedly the "BEST VALUE ON CAPITOL HILL!!"
Abandoned Rowhouses in DC
 Abandoned rowhouses awaiting the developers wrecking ball in the Washington, DC neighborhood of 'NoMA.' The 400 block I Street NW
Saturday, February 25, 2006
New Bubble Blog: BubbleTrack
A hardy welcome to bubblesphere newcomer BubbleTrack. "This blog analyzes the housing market in the northeastern region of the United States. In addition to general market commentary, BubbleTrack provides market and news analysis based on a complex trending tool called BATT." There are only 3 posts at this time, but this blog looks very promising. :-)
Friday, February 24, 2006
Graphs of Northern Virginia Real Estate Numbers
The Northern Virginia area is a wealthy suburban area located just across the Potomac river from Washington, DC. The statistics for the following graphs include "Fairfax and Arlington, and the cities of Alexandria, Falls Church, Fairfax, and the towns of Vienna, Herndon and Clifton." The residential real estate market has declined dramatically after a multi year boom period.
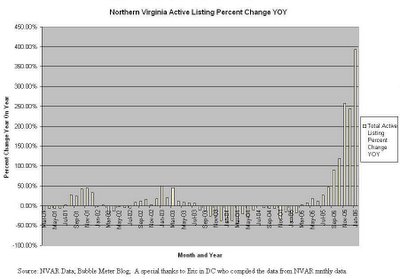
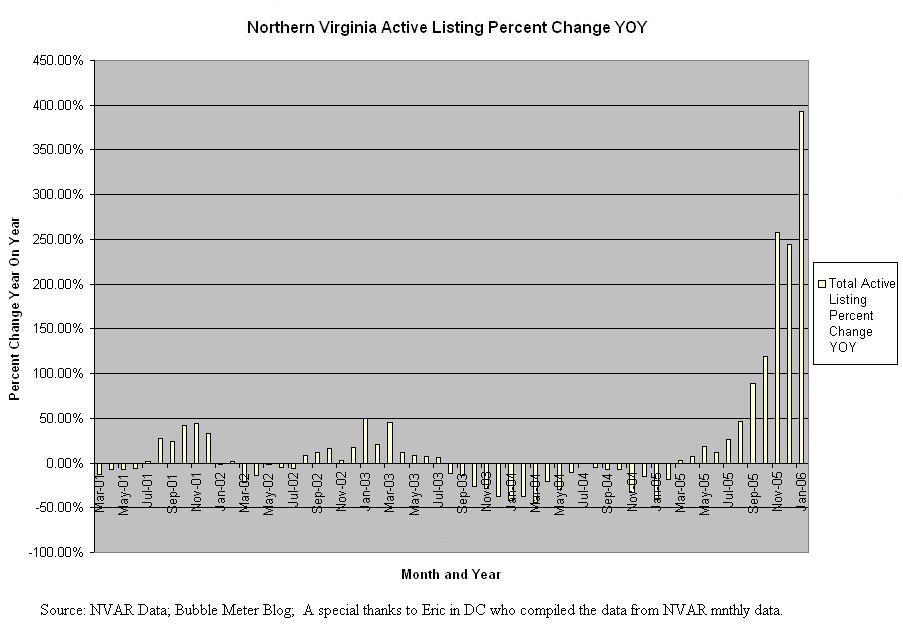
Active listings (inventory) are exploding in Northern Virginia as speculators and others want to sell properties. [click on image for larger version] "Inventory spiked last year with more than 7,000 active listings. For nine consecutive months in 2005, inventory in Northern Virginia increased compared to the previous year. The year ended with 5,659 active listings, 244 percent more homes on the market compared to December 2004. (The Connection, Feb 16)"
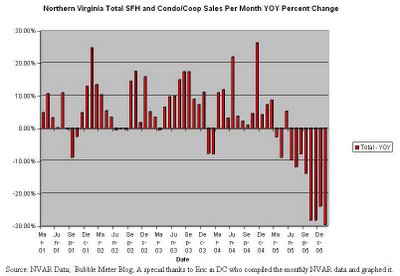
Meanwhile the number of sales per month continues to decline compared to last year's monthly sales.
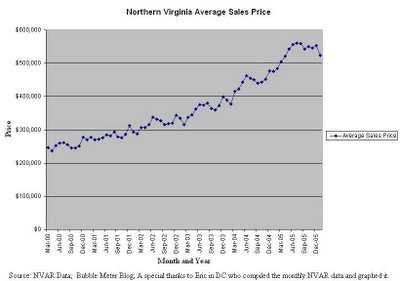
Finally, the average price has peaked. Some would argue it is a seasonal effect. However, the number of active listings in January 2006 was 392% greater then January 2005. At the very same time the number of housing units sold in January 2006 was 29.6% less then in January 2005. Housing affordability remains at an all time low in the area. There will be no spring buying frenzy. Expect continued price declines in the Northern Virginia housing market.
A huge thanks to Eric in DC who compiled the numbers from the Northern Virginia Association of Realtors website.
Active listings (inventory) are exploding in Northern Virginia as speculators and others want to sell properties. [click on image for larger version] "Inventory spiked last year with more than 7,000 active listings. For nine consecutive months in 2005, inventory in Northern Virginia increased compared to the previous year. The year ended with 5,659 active listings, 244 percent more homes on the market compared to December 2004. (The Connection, Feb 16)"

Meanwhile the number of sales per month continues to decline compared to last year's monthly sales.
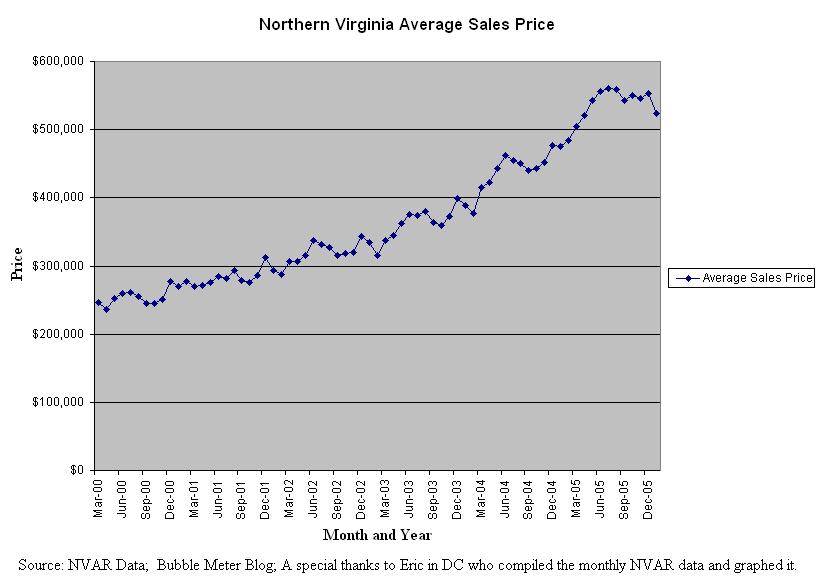
Finally, the average price has peaked. Some would argue it is a seasonal effect. However, the number of active listings in January 2006 was 392% greater then January 2005. At the very same time the number of housing units sold in January 2006 was 29.6% less then in January 2005. Housing affordability remains at an all time low in the area. There will be no spring buying frenzy. Expect continued price declines in the Northern Virginia housing market.
A huge thanks to Eric in DC who compiled the numbers from the Northern Virginia Association of Realtors website.
Thursday, February 23, 2006
Abandoned Building Near Washington Convention Center

Abandoned building located along the 600 block of L street NW in Washington, DC.
New Housing Bubble Site
There is a new housing bubble site called Sonoma Housing Bubble. It just started in February, but judging from existing content it is a very promising site. Sonoma is located north of the San Francisco area. Welcome to the bubblesphere. :-)
Wednesday, February 22, 2006
Update V: NVAR Discrepancies Resolved
The NVAR data for January 2006 for Greater Northern Virginia has been corrected. Jill, the Communications & Media Relations Manager for the NVAR, wrote "the numbers are now correct ... and final." The data has been updated and is correct on the following webpages:
Home Sales Statistics January 2006 (NVAR)
Greater Northern Virginia Home Sales Spread Sheet (NVAR)
Home Sales Statistics January 2006 (NVAR)
Greater Northern Virginia Home Sales Spread Sheet (NVAR)
Thanks to my readers who originally alerted me to the discrepanciess in the NVAR data. Keep a sharp eye open. Bubble Meter will continue to seek the truth about this speculative episode.Sales prices for the first month of 2006 in Greater Northern Virginia ( including Prince William, Loudoun, Fauquier, Culpeper, Madison, Clark, and Rappahannock counties) also followed an upward trend as did closer-in Northern Virginia region. The average sales price was up 13.4% from the January 2005 average of $440,426 to the January 2006 sales price average of $499,456.
Units sold were 28.1% below January 2005 levels with 2,292 units sold in January 2006.
Update IV: NVAR Discrepancies
The NVAR is in the process of resolving and fixing the data involving the January 2006 for the Greater Northern Virginia area. They have a 'new' formula that is being used to recalculate the average sales price for January 2006. Jill M. Landsman who is the Manager, Communications & Media Relations for the NVAR wrote me today: "I am going to re-figure that average price NOW, based on the newly suggested formula. For both 2005 and 2006 amounts .. I need to get all the new data from the MRIS database for the sales volume info so it will take time to re-calculate." I believe this is the same formula that was used in the numbers used for December 2005 and before.
See Previous Posts:
Some NVAR January 2006 Data is Incorrect (Feb 19)
Update: NVAR Data Discrepancies (Feb 17)
Discrepancies in Northern Virginia Association of Realtors' Data (Feb 15)
Pages that have known problems on NVAR Site:
Home Sales Statistics January 2006
Greater Northern Virginia Home Sales Spread Sheet
Hopefully, discrepancies in the data will be resolved today or tomorrow. The new correct data will then need to be published on the NVAR site. A special thanks to Jill for being very responsive to my inquires.
Stay tuned. More information will be published as it becomes available.
Baltimore City: 224 N. Montford
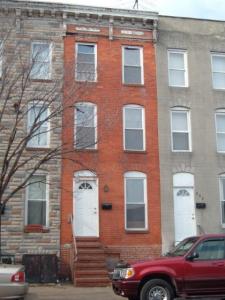 This rehabbed rowhouse is available for 210K and is located ay 224 N. Montford in Baltimore, MD. It is an area that is just starting to gentrify 3 blocks north of Patterson Park. Crime and terrible schools are significant problems here. Despite being 3 floors it is only 1,128 square feet.
Craigslist Posting
Maryland Department of Assessments and Taxation
"Wow!! This 3-Sty Home is a short Walk to Park. Enjoy a Jaccuzi Tub, New Plumbing, Carpet, Floors, Recessed Lights, Update baths.
Selling First Come, to Conv/Cash Buyer with $5,000 deposit.. Seller will Pay $5000 to Buyers Closing Costs + $5000 Referral Fee. Buyer Must Settle by Mar 24, 2006. Hurry!!"
The current owner bought it for 34,500 from the Secretary of the United States on 5/10/2005. They rehabbed it then putting in the Jacuzzi, New Plumbing Carpets, Recessed lighting, updated bath and the obligatory granite countertops.
Now that the owner has added value to the house by renovating it, he is trying to sell it for a profit.
Will he be able to sell it at 210K?
Probably not as the rowhouse is narrow. It is located at the gentrification frontier. Additionally, there is a growing inventory of rowhouses available for sale nearby.
Tuesday, February 21, 2006
David Lereah's New Book 'Why the Real Estate Boom Will Not Bust'

David Lereah the chief economist of the National Association of Realtors is about to publish a new book that will be released February 21, 2006. The title of David Lereah's new book is Why the Real Estate Boom Will Not Bust.
His previous book was 'Are You Missing the Housing Boom,' which featured these words on the cover "Why home values and other real estate investments will climb through the end of the decade - and how to profit from them."
Catherine a poster on the Housing Bubble Blog wrote this:
I WISH TO HELL these economists and spokespeople for the NAR would add the disclaimer (which is their mission statement):
The core purpose of the NATIONAL ASSOCIATION OF REALTORSî is to help its members become more profitable and successful.
To media report‚…the representatives of the NAR are NOT unbiased and measured observers of housing econonics! They DO NOT have any inclination to enlighten or educate the general public beyond their stated purpose of furthering the profiteering of their dues paying members!
They are foxes in the henhouse! Blech!
Amen sister! It is despicable how the media generally treats proffesional liars like David Lereah, who have a vested interest in the housing bubble, as if they are unbiased experts on the subject. David Lereah is not paid the big bucks to enlighten the public, but rather to make Realtors more "profitable and successful".
I have not read David Lereah's new book. However, I am sure he spends much time reassuring would be real estate 'investors' that real estate is a good investment. Don't trust Lereah, listen to unbiased economic experts who are not paid shills.
Update: There has been some questions asked whether this is just a revised book or truly a new book. The image on the cover is the same. The title is different. Here are some more links.
Random House Author Spotlight: David Lereah
Random House: Why the Real Estate Boom Will Not Bust
Check out this Bubble 'Logic'
Check out this listing on Craigslist:
BUBBLE BURST-PROTECT YOURSELF NOW
Protect yourself and do as all the rich people are doing! Get all of your equity out of real estate before the BUBBLE BURSTS and you lose it all!
Fast, Easy and No upfront costs. YOU are number ONE. Email for step by step guide to buying Investment Properties below market and make money!Pay plan is $300 on very 100k borrowed.
Payment plan is 1.25%.........UNBEATABLE!!!!!!!!!!!!!......this is a no brainer.
Monday, February 20, 2006
Bubble Sphere Roundup
South Florida is very bubbilicious, especially the condo projects that are sprouting like weeds upon the Miami area skyline. That is why, the bubble sphere warmly welcomes a new blog called South Florida Real Estate Bubble. The local housing bubble blogs provide unique perspectives. In one post the blogger blogs "As I drive around town, there are more and more "For Sale" signs popping up. Reality is starting to sink in and as I predicted, those wanting to sell are getting somewhat antsy. The rush to the exitway has begun." Highly recommended.
Housing Panic has a few noteworthy posts including: 'Stand in line with 3,600 other dolts. "Win" lottery to buy a condo. Lose your shirt. Welcome to the new reality' and also 'Follow the vacancies... Good God, this is such obvious stuff. Housing Panic does a great job in weaving information together from various sources and thereby offering a more complete picture of the situation.
Want to see overpriced sh*tboxes? OverValued dishes out great examples of overpriced sh*tboxes available for sale to unsuspecting buyers, crazed speculators or people who just want to laugh at the bubble madness.
There are many other great posts being written by my fellow housing bubble bloggers. The links to other bubble blogs are located on the right bar of the page. A big hearty thank you to all the housing bubble bloggers who are shining the light on the speculative episode that is the housing bubble. :-)
Sunday, February 19, 2006
Some NVAR January 2006 Data is Incorrect
Parts of the January 2006 Northern Virginia Association of Realtors' (NVAR) data is incorrect.
In the Greater Northern Virginia Homes Sales Report it states that the YTD (Year to Date) SALES VOLUME is $1,144,753,710 and that the YTD NUMBER HOMES SOLD is 2,298. Since January is the first month of the year, the year to date numbers will be the same as the numbers for January of that year. Thus, if we take the total sales volume ($1,144,753,710) and divide by the number of homes sold (2,298) we get $498,152 which would be the average sales price. The $498,152 is different then the $480,931 average sales price listed.Something is wrong here. Looking at the other January reports from 2005 and 2004, if one divides the YTD sales volume by the YTD number of homes sold, one get the same number as the YTD average sales price. This is not the case when it come to the January 2006 Greater Northern Virginia numbers.
This new information calls into questions parts(s) of the following webpages:
Northern Virginia Area Home Sales Report (NVAR)
Home Sales Statistics January 2006 (NVAR)
Average Sales Price in Greater Northern Virginia Falls Significantly (Bubble Meter)
Discrepancies in Northern Virginia Association of Realtors' Data (Bubble Meter)
The Bubble Meter Blog will continue to follow this issue as it unfolds. The NVAR needs to release accurate market statistics. Bubble Meter will be following up with my contact over at the NVAR on Monday. If my readers have other information that should be passed along please let me know.
New Condo Listings at 1602 Isherwood Street NE
Joe O'Hara has new listings for two condo units located at 1602 Isherwood Street NE. Joe was the realtor who sold the property located at 1228 Walter Street SE. Joe has commented on this blog a few times.
1602 Isherwood St NE Unit #4 (267.9K)
1602 Isherwood St NE Unit #1 (259.9K)
Both of these units are 1br 1 ba have 750+ sq. feet. "Spacious condo in recently completed multi-unit row house in developing Northeast Capitol Hill neighborhood. This lovely unit on the first floor features a large living room, nice size bedroom, galley kitchen, and 2 offices/dens. The condo has been completed updated with original hardwood floors restored to perfection. Close to Metro and major bus lines. A great opportunity for first-time homeowners. Low condo fee of $165 per month. " There is an open house today ( 2/19) between 1-4pm.
Will these units sell at this price?
Significant Price Reduction for Condo in Northern Virginia
Large price reductions are becoming more common in the bubble markets as the housing market continues to decline. The inventory is growing steadily in most bubble markets as sales continue to decline.
One of my readers sent this listing where significant price reductions are listed for new condo construction in the outer suburbs of Washington, DC.
One of my readers sent this listing where significant price reductions are listed for new condo construction in the outer suburbs of Washington, DC.
Friday, February 17, 2006
Update: NVAR Data Discrepancies
There are still discrepancies in the NVAR data regarding what happened in January 2005 for the Greater Northern Virginia market.
Please See:
Original Post (Bubble Meter, Feb 15)
Home Sales Statistics January 2006 (NVAR)
Greater Northern Virginia January 2006 Home Sales Report (NVAR)
Greater Northern Virginia January 2005 Home Sales Report (NVAR)
Today, I spoke with Jill Landsman who is the Manager, Communications & Media Relations for the Northern Virginia Association of Realtors. She seems legitimately concerned about getting to the bottom of the discrepancies between the 417,495 and 440,426. She recalculated the data for January 2005 in the Greater Northern Virginia area and came up with 417,395 as the average sales price for condos and single family homes. What is the cause of this discrepency?
Jill assured me that the discrepancies will be fixed by the end of next week.
The Decline of the Great American Home ATM
 The 'great' American home ATM is becoming less well stocked and is becoming more costly to operate . How will this effect consumer spending which accounts for 70% of the US economy?
Thursday, February 16, 2006
Wednesday, February 15, 2006
Discrepancies in Northern Virginia Association of Realtors' Data
Thanks to my readers who pointed out discrepancies in the Northern Virginia Association of Realtors. The inconsistency consists for January 2005 statistics for the Greater Northern Virginia area:

In the original January 2005 market statistics the average sales price for all housing units in the Greater Northern Virginia areas was 440,426. Sales were 3,106 units.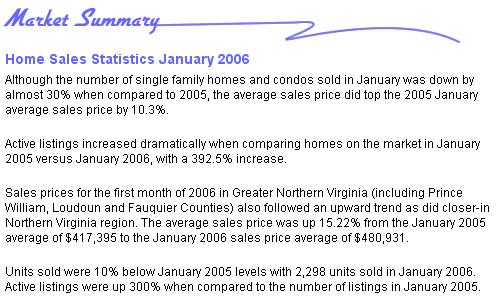 However, in the January 2006 market summary report its says that the January 2005 sales price was 417,495. 417,495 is not equal to 440,426. The report then uses those number to say the average sales price increased 15.22% YoY ( from 417,495 to 480,931) when based on the original January 2005 number there would be a 9.1% increase.
Also in the January 2006 market summary its says that 2,298 housing units were sold in the Greater Northern Virginia area in January 2006. It continues and states that represents a 10% decrease from January 2005 numbers. So that would mean January 2005 numbers would be about 2,550. However, in the January 2005 report there were 3,106 units. If they used the original numbers of 3,106 it would mean there was a much more ominous 27% decrease in units sold compared to January of last year.
What is the truth? Are the Realtors intentionally giving out wrong statistical information or are they just making innocent mistakes?
For now, I will give the Realtors the benefit of the doubt.
Update 2/16/ 4:55: [Some of the numbers have already been fixed.]
Realtors Promoting Condotels
The National Association of Realtors is promoting the condotel craze. What exactly is a condotel? provided this
Check out the Realtors field guide to the condotels because they "are the latest trend in lodging." A dose of healthy skepticism is necessary. These condotels are 'wonderful' because you can convince yourself that you are buying leisure space while making an 'investment.'Unlike time shares, where owners have the right to visit a property for a few weeks a year, or traditional condominiums, where individuals own the units and can do what they want with them, condo hotels are a hybrid. Investors own a specific condo and pay property taxes, insurance, and maintenance fees. Hotel management companies rent out the rooms, rotating reservations among the various
units and splitting the revenue fifty-fifty with the owners.
Units often come furnished and owners can't make changes to the decor or add personal items such as photos. "You wouldn't know the room is owned by somebody else," says Rick Davis, a Los Angeles attorney specializing in condo-hotel projects. (Business Week, Dec 9, 2005)
Tuesday, February 14, 2006
Average Sales Price in Greater Northern Virginia Falls Significantly
The Northern Virginia Association or Realtors (NVAR) has posted their monthly January Market Summary here is an excerpt:
Wow! Try spinnin that!
But here is the kicker. Here is an excerpt from the December report:Although the number of single family homes and condos sold in January was down by almost 30% when compared to 2005, the average sales price did top the 2005 January average sales price by 10.3%.
Active listings increased dramatically when comparing homes on the market in January 2005 versus January 2006, with a 392.5% increase.
Sales prices for the first month of 2006 in Greater Northern Virginia (including Prince William, Loudoun and Fauquier Counties) also followed an upward trend as did closer-in Northern Virginia region. The average sales price was up 15.22% from the January 2005 average of $417,395 to the January 2006 sales price average of $480,931.
Sales prices in Greater Northern Virginia (including Prince William, Loudoun and Fauquier Counties) followed the same upward trend as the closer-in region. The average sales price was up 18% from December 2004 at $525,274 for December 2005. Units sold were 20% below December 2004 levels with 3,984 units sold in December 2005. The number of active listings is up 199% over December 2004.The average sales price for a single family home and condo in Greater Northern Virginia in December 2005 was $525,274, a month later, in January 2006 the average sales price was lower at $480,931. Therefore, the average sales price was 8.5% percent less in January 2006 then in December 2005.
Wow! Try spinnin that!
The Housing Market According to the White House
In the White House's report on the economy there is a section on the housing market. Here is the text:
Housing Prices
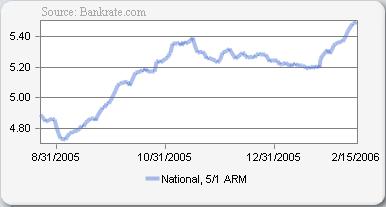
"During the past five years, home prices have risen at an annual rate of 9.2 percent. This increase was largely supported by two factors: first, an increase in housing demand, driven by a rise in nominal per capita disposable income of 3.4 percent per year; second, a decline in the cost of financing house purchases, due to a drop in the monthly payment on 30-year fixed-rate mortgages of 4.3 percent per year. Housing demand was also boosted by increased household formation and a strengthening job market. Supply constraints, due to limits on the supply of buildable land in some areas, also contributed to rising prices over the past five years. After falling during 2004, mortgage rates were roughly flat at 53⁄4 percent in the first three quarters of 2005, and then edged up along with other long-term interest rates in the fourth quarter. As a result, a well known measure of housing affordability has now fallen to about its average level over its 34-year history."
"To gauge the extent to which house price increases have reflected fundamentals, some studies compare housing prices to rents. The rent-to-price ratio is a real rate of return on housing assets in the same way that the earnings-to-price ratio measures the real rate of return on corporate stocks. Viewed as an asset, a home should bear a real return similar to the real return available
on alternative assets, such as stocks and bonds. As real interest rates have fallen in the United States and in most other Organization for Economic Cooperation and Development (OECD) countries, the rent-to-price ratio for housing has likewise fallen across a broad range of OECD countries. A recent OECD paper concluded that the decline in the rent-to-price ratio in the United States from 2000 through 2004 was roughly consistent with the decline in interest rates over the same period."
Residential Investment
"In response to strong demand and the consequent rise in prices, builders began construction on more than 2 million new homes during 2005, one of the highest rates of homebuilding on record. Similarly, residential investment, at 6 percent of GDP in 2005, was at its highest level since 1955. During 2005, growth of residential construction contributed about half a percentage point to real GDP growth. Homebuilding in 2005 was slightly in excess of the pace of about 1.9 million starts per year that some economists have estimated is compatible in the long run with U.S. rates of household formation and other demographic influences."
"During the next five years, the Administration expects the pace of homebuilding to decrease gradually because of demographic trends and slowly rising long-term interest rates. A gradual slowing of homebuilding appears more likely than a sharp drop because the elevated level of house prices will sustain homebuilding as a profitable enterprise for some time. On balance, residential investment is not projected to contribute to real GDP growth during the four quarters of 2006; in subsequent years, it is expected to subtract a bit from overall growth. "
Housing Prices
"During the past five years, home prices have risen at an annual rate of 9.2 percent. This increase was largely supported by two factors: first, an increase in housing demand, driven by a rise in nominal per capita disposable income of 3.4 percent per year; second, a decline in the cost of financing house purchases, due to a drop in the monthly payment on 30-year fixed-rate mortgages of 4.3 percent per year. Housing demand was also boosted by increased household formation and a strengthening job market. Supply constraints, due to limits on the supply of buildable land in some areas, also contributed to rising prices over the past five years. After falling during 2004, mortgage rates were roughly flat at 53⁄4 percent in the first three quarters of 2005, and then edged up along with other long-term interest rates in the fourth quarter. As a result, a well known measure of housing affordability has now fallen to about its average level over its 34-year history."
"To gauge the extent to which house price increases have reflected fundamentals, some studies compare housing prices to rents. The rent-to-price ratio is a real rate of return on housing assets in the same way that the earnings-to-price ratio measures the real rate of return on corporate stocks. Viewed as an asset, a home should bear a real return similar to the real return available
on alternative assets, such as stocks and bonds. As real interest rates have fallen in the United States and in most other Organization for Economic Cooperation and Development (OECD) countries, the rent-to-price ratio for housing has likewise fallen across a broad range of OECD countries. A recent OECD paper concluded that the decline in the rent-to-price ratio in the United States from 2000 through 2004 was roughly consistent with the decline in interest rates over the same period."
Residential Investment
"In response to strong demand and the consequent rise in prices, builders began construction on more than 2 million new homes during 2005, one of the highest rates of homebuilding on record. Similarly, residential investment, at 6 percent of GDP in 2005, was at its highest level since 1955. During 2005, growth of residential construction contributed about half a percentage point to real GDP growth. Homebuilding in 2005 was slightly in excess of the pace of about 1.9 million starts per year that some economists have estimated is compatible in the long run with U.S. rates of household formation and other demographic influences."
"During the next five years, the Administration expects the pace of homebuilding to decrease gradually because of demographic trends and slowly rising long-term interest rates. A gradual slowing of homebuilding appears more likely than a sharp drop because the elevated level of house prices will sustain homebuilding as a profitable enterprise for some time. On balance, residential investment is not projected to contribute to real GDP growth during the four quarters of 2006; in subsequent years, it is expected to subtract a bit from overall growth. "
Monday, February 13, 2006
Washington City Paper: Just Reduced
The Washington City Paper has a long article about the housing situation in DC called' Just Reduced'.
The local media and many industry analysts are now talking about the bubble in the past tense. As evidence, they cite the longer periods that homes are staying on the market, the plateaus in sales prices, and the generally saner bidding environment.
But many agents can’t seem to part with their dear epoch. “This was a great year for us,” says Gill of 2005. “People are anticipating a decline in prices because of what they’ve read in media.…And you know what? It’s not happening,” says Gill.
Virginia Walker of Weichert Realtors says, “Some people think the market is falling, but it isn’t"
Will there be a Spring Boom?
Spring is the busiest season for real estate. "Indeed, April through July outpace the balance of the year in sales, historic data at the National Association of Realtors indicates. So there'll surely be more home inventory and variety then. But you better move fast, because that's just what other home hunters are doing (Bankrate)."
Some real estate agents are hoping a hopping spring will reverse the current price declines occurring in most bubble markets. The hope is that with the spring season a large amount of buyers will swoop in, raise demand, and bid up prices. Real Estate Blanche Evans writes "What about housing? There's a lot of positive news that suggests that housing may have had its "rest." Spring might catapult housing into another record year."
On February 8th, the Wall Street Journal reported that "With the key spring selling season about to get under way, the inventory of homes on the market is climbing sharply in a number of major cities. Nationwide, there were 2.8 million existing houses and condominiums on the market at year end, according to the National Association of Realtors. That is down slightly from November's 2.9 million listings, but up 26% from a year earlier. Adjusted for seasonal variations, inventories have climbed 38% since April, according to Goldman Sachs Chief U.S. Economist Jan Hatzius, the largest eight-month increase on record."
For some sellers and market analysts their hope is focused on a solid spring. The coming reality in spring will be more buyers but also more sellers. Inventory will continue to increase in most bubble markets. Prices will likely continue to fall during the spring months or at best remain flat in the bubble markets. This year's spring selling season will be very disappointing for sellers expecting the madness of last year's spring.
Sunday, February 12, 2006
The Snowball is Just Getting Rolling
 Some has claimed that the housing bubble is hyped and that not much has happened. They are not concerned about falling prices as there will be a soft landing.
The housing bubble snowball has just started to roll. The snowball in the picture may look small and unthreatening, but it is just starting out. Wait, it will grow bigger, become faster and have more force.
Lot of Snow


Here in DC we got blasted with the winter weather. :-) The snow is so pretty. I am going sledding later today. :-)
Snow Covered Trees
 Snow covered trees in Silver Spring, MD. The snow on the trees is really pretty. The hazy image from my camera phone does not capture the true beauty of the scene.
Saturday, February 11, 2006
BubbleSphere Roundup
At Patrick.net there is a new topic about the 'Spring Bounce' in the San Francisco housing market.
I know I had a link to the site during the week, but the David Lereah spoof is SO funny it is worth a repeat mention. Keep up the solid reporting Marinite. :-)
The DC Bubble has posted two interesting charts about the growing inventory in the Washington, DC area.
There are also links to some fascinating economic blogs further down on the right side of this page. Links to sites such as Angry Bear, The Mess That Greenspan Made and Calculated Risk.
Finally, Northern New Jersey Real Estate Bubble has a historic look at the "collapse of the 1980's real estate bubble. For those that don't know, the NY Metro area saw spectacular gains in real estate during the 80's. It, like all bubbles that came before it, collapsed just as spectacularly"
[It is snowing very heavily here in the Washington, DC metro area. I am planning an original piece for sometime tomorrow.]
Friday, February 10, 2006
The Trade Deficit & The Housing Bubble
"The U.S. trade deficit soared to an all-time high of $725.8 billion in 2005, pushed upward by record imports of oil, food, cars and other consumer goods. " The US trade deficit must be reduced. It is an economic noose that eventually will be tightened. The US spends way too much time and money buying, selling, renovating and financing bubblicious real estate. Figuring out and reducing the trade deficit is difficult but very necessary.
925 Westminster Street NW

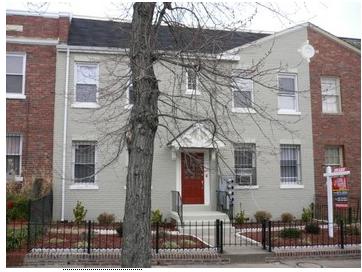
The lovely blue colored two unit rowhouse is available for sale 1.1 million dollars. "Investor alert!! 2 two lvl homes (sep apartments) in a grandvictorian on a quiet st near u st metro. 2 units generate $5200 in monthly rent. Condo conversion in process. 2 parking spaces in rear." It is 3,400 sq, feet. 2 parking spaces in the back. It has been on the market for 119 days. MLS # DC5422736. 925 Westminster St NW is located in a partially gentrified area near the eastern part of the U street corridor.
The property was purchased on 2/2/2004 for 715K.
Will the two units sell as a package for 1.1 million?
The U Street Corridor is a hot neighborhood. There are a many other properties available for sale in the area . What do the readers think?
Thursday, February 09, 2006
David Lereah Spoof
Remember Saddam Hussein's spokesman who kept on lying about the Iraq war. There is this really funny spoof over at Marin Real Estate Bubble involving David Lereah [The Chief Economist of the National Association of Realtors]. Check it out. Very funny.
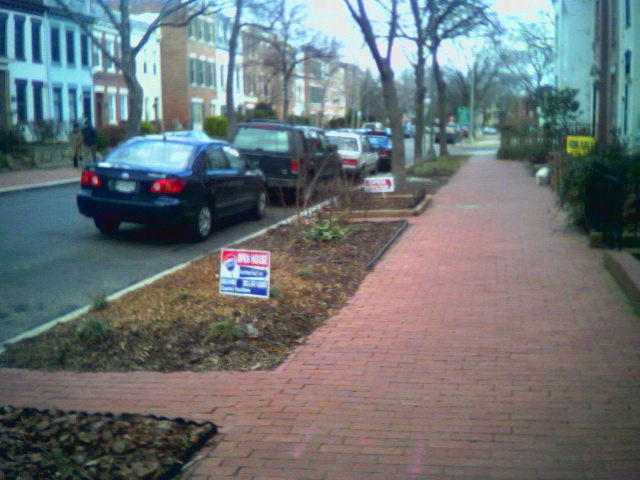
Update: Speculators Looking To Get Out
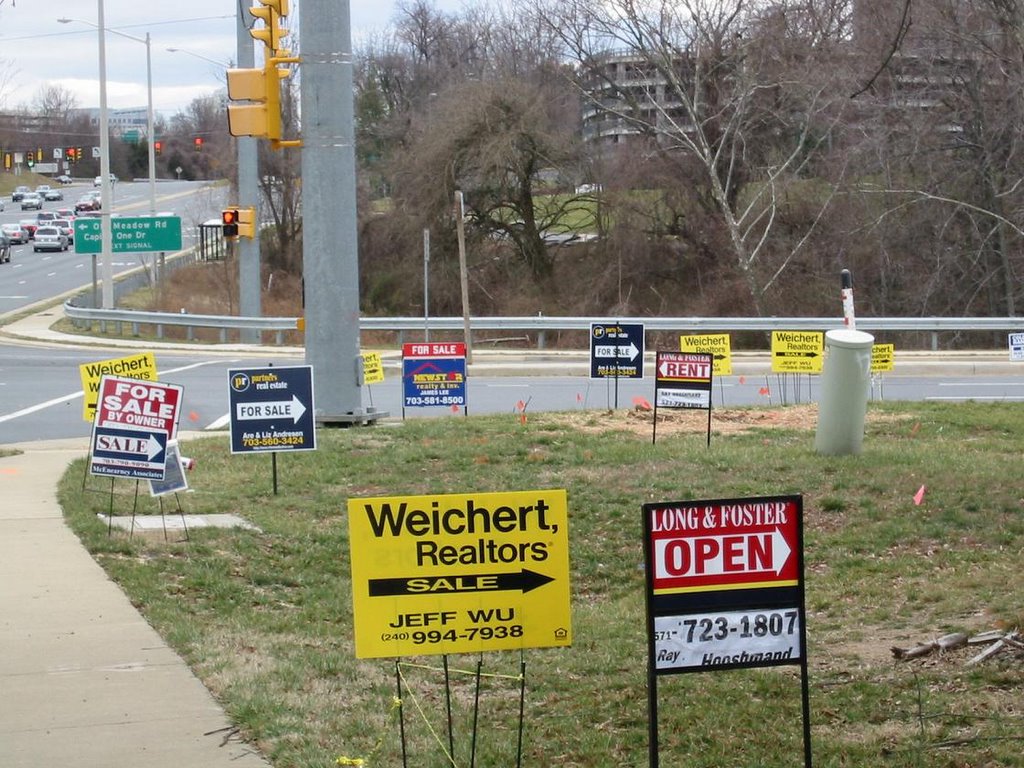
There are now 15 for sale signs and 1 for rent sign located at this intersection. These signs are all for the Gates of Mclean complex. [Click on image for larger version]
Previous Posts:
Speculators Looking to Get Out (Jan 25)
In the picture taken on January 25th there were only 13 housing signs. Now, there are 16 housing related signs. I can just see the real estate agents coming here in the middle of the night repositioning signs so that their sign is most prominently featured. Its very bubblicious.
I'm Losing X Per Day on My Home
Remember last summer when real estate cheerleaders were saying "My house is going up $300 dollars a day." Now, if prices go down 10% this year on a 700K San Diego home will people be saying "My house is losing $200 dollars a day." ?
NOPE. People have a tendency to boast and spread the word about their financial gains, but stay quiet about their financial losses.
NOPE. People have a tendency to boast and spread the word about their financial gains, but stay quiet about their financial losses.
Wednesday, February 08, 2006
Update II: 1228 Walter Street SE
The listing for 1228 Walter Street SE has been pulled from the MLS. The sale is pending.
Previous Posts
Update 1228 Walter Street SE
Original Post 1228 Walter Street SE
So did the rowhouse sell at its reduced price of 529K? Or did the buyer lowball?
Information is not yet available.
Previous Posts
Update 1228 Walter Street SE
Original Post 1228 Walter Street SE
So did the rowhouse sell at its reduced price of 529K? Or did the buyer lowball?
Information is not yet available.
Phoenix Housing Market Inventory is Exploding
The inventory is just exploding in the Phoenix metro area. According to ZipRealty and Bubble Tracking Blog the available homes for sales as of Feb 7th, 2006 was 33,550. On Jan 2nd it was 26,715. That is a 25% increase in inventory in just over a month. Phoenix is extremely bubblicious. The flood of inventory is just incredible. For more information see this post over at Housing Bubble Blog.
*WARNING This information is in dispute and it maybe much lower* If you know more info please shed light on this.
*WARNING This information is in dispute and it maybe much lower* If you know more info please shed light on this.
HomeBuilders' Incentives
Increasingly, homebuilders are either offering discounts and or incentives to sell their new homes.
• In Virginia, buyers can get a free flat-screen TV at one of Bozzuto Group's condo projects, or a media room in a Stanley Martin home.
• In Michigan, Winnick Homes offers a $5,000 upgrade allowance.
• In Kansas, Rodrock Development tempted buyers with $2,000 worth of backyard trees.
These incentives are pathetic. One is spending upwards of 300K - 800K on their new homes and they are offering incentives worth like .5% to 2% of the purchase price. Centex's 100K off one day sale puts these incentives to shame.
Tuesday, February 07, 2006
Toll Brothers slashes sales outlook again
Toll Brothers slashes sales outlook again as the housing bubble continues to pop. Reuters is reporting that
Luxury home builder Toll Brothers Inc. (NYSE:TOL - News) on Tuesday slashed its forecast for home sales for the second time in three months, driving its shares down as much as 4 percent, as first-quarter new orders fell 29 percent on slumping demand.
Toll is widely seen as a bellwether for the U.S. housing market. Its deteriorating forecasts may indicate that the slowing U.S. housing market may be deteriorating faster than previously thought, Raymond James and Associates analyst Rick Murray said.
"This would seem to indicate that those trends have not reversed course, and perhaps have even accelerated to the downside," Murray saidToll now said it expects to close on sales of 9,200 and 9,900 homes in the fiscal year, ending on October 31, down from a previously lowered view of 9,500 and 10,200 homes. It attributed its revision to slowing demand and delays obtaining inspections, certificates of occupancy and utility hookups.
New orders during the quarter fell to 1,572, from 2,209, while the value of the contracts declined 21 percent, to $1.16 billion.
Expect Toll Brothers' stock to continue to decline as the housing bubble continues to unfold.
Don't Be a F*cked Borrower
I urge you not to become Another F*cked Borrower. SoCalMtgGuy is doing a terrific job warning potential and current buyers of how NOT to become another f*cked borrower. The writer is a mortgage broker in southern California. The blog / website Another F*cked Borrower is absolutely fantastic. He works in the field as a professional. This guy knows his stuff.
The toxic mortgages that have been pushed in recent years has reached obscene levels. Some of the f*cked borrowers are now are welcomed into the mortgage office with a red carpet would have been laughed out of there a mere 5 years ago. Something is wrong when lenders lend 400K to someone earning 50K who has put zero down and has a credit score in the mid 500s. Just because one can get a loan, does not mean they should.
Enough is Enough.
Monday, February 06, 2006
Interesting Search
I was looking through the traffic statistics over at StatCounter for Bubble Meter Blog. I noticed that there were a huge number of hits coming from searches 'ameriquest commercial.'
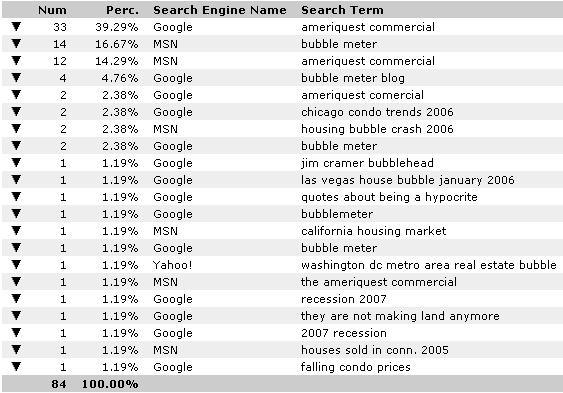
Why? Ameriquest had an interesting commercial on the superbowl yesterday. If one searches for 'ameriquest commercial' on Google then the below results appear.

Notice how the Bubble Meter site is the 5th top match. It points to this post Ameriquest Commercial Post on BubbleMeter. My Ameriquest post criticizes a different commercial that they aired back in December.

Two Competing Rowhouses on Capitol Hill
 On Sunday, I visited two open houses on Capitol Hill. These two houses were literally 4 rowhouses away from each other. One was located at 1213 C ST SE, the other one was located at 1221 C ST SE. It is a historic area with cute charming rowhouses that is pretty well gentrified.
 The property located at 1221 C ST SE is priced at 525K. It was just reduced from 535K. Before that it was priced at 549K. It is for sale by owner. MLS # DC5499473.
The rowhouse was just recently renovated. It has 3 Bedrooms, 3 floors. It looks nice inside. Each floor is really small. 1.5 Bathrooms, 2 fireplaces, hardwood floors, spacious rear yard, new rooftop / hvac systems, upgraded electrical and plumbing systems. Custom porcelain tile for the kitchen countertops. On the market 25 days.

The competition located just 4 houses down the street at 1213 C Street SE is priced at 499K. MLS # DC5509211 . "Classic capitol hill location...Positioned within steps of all the hill has to offer. This two bedroom/one and one half bath home was completely renovated in 2000 with all the bells and whistles--hardwood floors, granite kitchen, gas fireplace, jacuzzi tub and crown molding. Plus, a super deep rear garden which backs to south carolina avenue!!" It has 2 bedrooms [ one is closet sized small ], 1.5 bathrooms. Gut rehab job in 2000. On the market 16 days.
There were many people visiting both rowhouses. The vast majority of the home visitors were just browsing and not seriously interested. I asked the owner in 1221 C Street SE about the competition just down the street. He responded "I don't see it as competition. This one is 50% bigger. Look at the price per square foot." It is not 50% bigger.
- So which one is a better buy? 1221 C Street SE
- Which one will sell first? Depends. Which one will be reduced in price.
- Will either one sell at its listed price? Probably Not.
Sunday, February 05, 2006
Super Bowl Roundup
It's Super Bowl Weekend!
Here are some Seattle, Pittsburgh, and Detroit Links:
Detroit's Economy & Housing Market
Seattle Bubble Blog
Seattle Housing Index (OverValued Blog)
Pittsburgh Housing Index (OverValued Blog)
Bubble SuperBowl (OverValued Blog) [added later]
Go Steelers! I'm rooting for the non bubblicious metro area.
Enjoy your weekend!
New Condo In Arlington, VA
 "New 1 bedroom condo in claredon 1021 located in the ballston area. Amenities include rooftop swimming pool, with a great view of washington d.C., state of the art gym, a quiet courtyard, garaged underground parking, 24 hour security desk, and much more! Short walking distance to metro and minutes from georgetown! Shopping and great dining available within walking distance. This is the one!!!"
It is 750 sq. ft. Here is the kicker! The property has been on the market for 80 days. It was reduced in price by 1K, from 480K to 479k. That represents a price reductions of much less then 1%. Pathetic. (MLS # AR5456348)
Will it sell at 479K?
Nope. It is priced to high for a one bedroon. There is a glut of condo units in the metro DC market. The price needs to be reduced.
Quick Programming Note
There is a growing amount of housing bubble related sites. I try hard to add links from my site to the new bubble sites that are of quality. If there are solid bubble sites that are missing from my links please email me: bubblemeter (at) gmail.com .
Additionally, I am always looking for interesting stories related to the housing bubble. I won't publish all of them, but if you have something worthwhile it may be published. Thanks.
A big thank you to all my readers. :-)
Additionally, I am always looking for interesting stories related to the housing bubble. I won't publish all of them, but if you have something worthwhile it may be published. Thanks.
A big thank you to all my readers. :-)
Friday, February 03, 2006

Thursday, February 02, 2006
Toll Brother's Stock
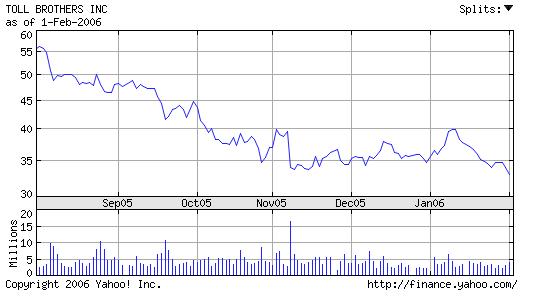 Toll Brother's stock continues to decline in price as the housing market declines. The homebuilder does most of its sales in the bubble markets.
ZipRealty's New Features
ZipRealty has implemented a bunch of new features that make it easier to search the real estate listings. ZipRealty has this webpage listing the new features. Here are my two favorite new features:
- Find Homes that have had Recent Price Reductions: "This is a great way to uncover homes where the seller may be more motivated and/or that may not have been presented in your original search results. You can find out which homes have published price reductions since they've been listed on the MLS. You can either search specifically for price-reduced homes or you can simply continue to browse all homes for sale. Any home price reductions will be automatically displayed on the home information page."
- Enhanced Interactive Map Search: "We have improved the functionality of our interactive map home search. Now, not only can you draw a box on the map to indicate where you would like to search, but you can also see pop-up descriptions that allow you to view home details directly on the map. To use this new functionality, visit the "Interactive Map" tab on your MyZipRealty page."
Wednesday, February 01, 2006
Detroit's Economy & Housing Market
The Super Bowl is being played this Sunday in Detroit. The injection of money into the Detroit area for the Super Bowl will do little to change the region's economic misery.
Detroit still has the highest percentage of people living below the poverty line (one-third). The unemployment rate of 6.8 percent trails only hurricane-paralyzed New Orleans.
Last week, Ford Motor Co., the company that gave its name to the stadium where the game will be played, announced it will lay off up to 30,000 workers. GM announced similar job cuts in November. (Palm Beach Post 1/31/06)
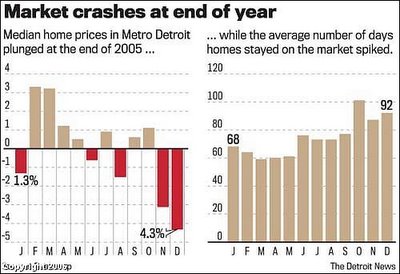
The troubled Detroit economy is putting a real damper on housing prices. The Detroit News reports:
Southeast Michigan's housing market took a sharp dive at the end of a weak 2005, signaling more tough times ahead with interest rates rising and a scarcity of new jobs.
Statistics released Monday showed median sale prices fell 4.3 percent in December -- the biggest monthly drop in 2005 -- and most sellers were waiting at least 3 months to find a buyer.
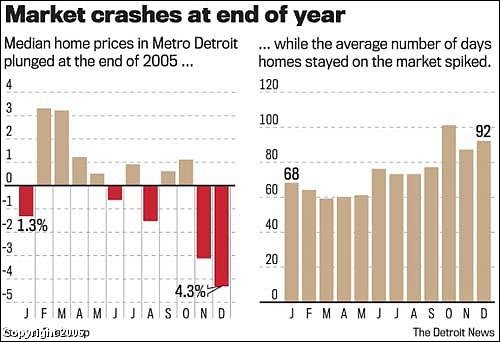
Poor sales in the final few months closed out a year in which homeowners were lucky to get a negligible increase in property value.The ongoing miserable economic conditions coupled with rising interest rates and tightening lending standards will cause the Detroit housing market to continue its decline in 2006.
The region's median sale price for single-family homes and condominiums was $156,000 in December, down from $163,000 a year earlier, according to Realcomp II Ltd., a Farmington Hills real estate listing service.
Total home sales fell 11 percent, while the number of homes listed for sale grew 11 percent.
The 3,735 homes that sold in December had spent an average of 92 days on the market, five weeks longer than the same time last year.
Real estate agents say their biggest problem is finding buyers for higher-priced homes, while sellers asking less than $150,000 are having mild success.
"There's an abundance of listings out there," said Larry Chetcuti, an agent with RE/MAX Prestige in Dearborn Heights, "but there's not an abundance of buyers."
Detroit's Sparsely Populated Inner City Neighborhoods
 The abandonment of inner city neighborhoods in Detroit occurred as people fled for suburban areas. Arson, crime and riots also took their toll on Detroit's inner city neighborhoods. Check out this Google Maps of a sparsely populated inner city neighborhood in Detroit.