Via Rebecca WilderIn 1879, Henry George ... found it perverse that we tax productive activities like work and innovative investment while letting landowners grow rich simply because they scooped up property at the right time. In that spirit, George called for a “Single Tax” on the unimproved value of land. There’s a certain compelling logic to the Single Tax that stands the test of time. When you tax income, aren’t you punishing people for working hard? But when you tax an asset like land, you’re simply encouraging the most valuable use of that land. In the years since George faded from the scene, a number of economists, from Milton Friedman to Paul Romer, have found virtue in the Single Tax...
Thursday, July 30, 2009
Abolish all taxes except...
...the property tax:

Wednesday, July 29, 2009
What Sort of Housing Style Do You Prefer?
 Or?
Or?
Or something completely different from the above two images?
Please join in the discussion of 'What Sort of Housing Style Do You Prefer?'
Tuesday, July 28, 2009
Case Shiller Home Price Index Up Again For Washington Area
The Case Shiller Home Price Index was up for the second month in a row in the Washington, DC metropolitan. In May, it rose .67% on a seasonally adjusted basis.
Is this the bottom for the DC area or will prices start declining again later in the year?
Here is MarketWatch Article on today's number's.
Is this the bottom for the DC area or will prices start declining again later in the year?
Here is MarketWatch Article on today's number's.
Monday, July 27, 2009
Home prices: DC vs. California and Florida
Graph: Home prices in DC proper, vs. California and Florida.
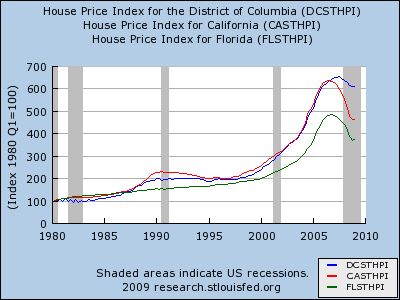
Home price data comes from the Federal Housing Finance Agency's House Price Index. Note that it only measures homes with conforming mortgages. (Homes with subprime mortgages are not counted.) Also note that the index is not adjusted for inflation.

Home price data comes from the Federal Housing Finance Agency's House Price Index. Note that it only measures homes with conforming mortgages. (Homes with subprime mortgages are not counted.) Also note that the index is not adjusted for inflation.
Sunday, July 26, 2009
Local Housing Blogs
Below is a small list of some of the local Washington, DC - Baltimore Area Housing Blogs:
These links are always on the right side of the Bubble Meter home page.
Thursday, July 23, 2009
"We needed a recession"
Thoughts from Harvard economist Jeffrey Miron:
By the end of 2005, it should have been apparent that the U.S. economy was fundamentally misaligned. We had significantly overinvested in housing and significantly underinvested in factories, plants, and equipment. In effect, we needed a recession: a period to readjust the balance between the different types of capital.
More broadly, failure is an essential aspect of free markets. Failure shows capitalism is working, because it means resources are moving from bad uses to good uses.

Tuesday, July 21, 2009
Monthly Home Price Changes Washington DC Metro Area

Click on image for larger view
Please note that there was much discussion on this blog about the meaning of the increase in home prices in April 2009. This was the first monthly price increase since 2006. Looking at the larger picture, it still seems that monthly price decreases will resume later this year. The prices decreases are not yet over. Expect small monthly price decreases later this year. In my mind most areas of DC are likely to see another 5 to 12% decrease in home prices.
Sunday, July 19, 2009
On vacation
I'm gone for summer vacation for the next two weeks. I'll be back in the first week of August. I have scheduled a few short posts to appear while I'm out, but David says he'll blog while I'm gone.
Here's my view for the next two weeks, assuming good weather:

Here's my view for the next two weeks, assuming good weather:

Saturday, July 18, 2009

Friday, July 17, 2009
Short sales are increasing
From The Washington Post:
The number of short sales completed jumped 208 percent during the first quarter of this year compared with the same period in 2008, according to a report issued last month by the Office of Thrift Supervision and the Office of the Comptroller of the Currency, which regulate banks.
Short sales could increase further as home prices continue to fall, leaving a growing number of borrowers owing more than their home is worth. Also, the Obama administration is implementing a program to pay lenders to accept less than the balance owed by the borrower in such deals. ...
Last year, about 5 percent of home sales in Loudoun County, one of the hardest-hit parts of the region, were short sales. Now they account for about 23 percent of the market, said Tony Arko, an agent for Market Advantage Real Estate.
Thursday, July 16, 2009
Home builder brings back ARMs
Home builder Toll Brothers is bringing back the adjustable rate mortgage in order to sell homes:
A farewell to ARMs? Not at Toll Brothers.
The luxury home builder is enticing home buyers with an offer on a “hybrid” adjustable-rate mortgage that offers a 3.75% rate for seven years that converts to an annual adjustable rate after that, reports our colleague Dawn Wotapka at Dow Jones.
Toll is bringing back a loan product that proliferated during the housing boom because it offered the prospect of lower monthly payments over the initial three-, five-, or seven-year fixed-rate period.
Wednesday, July 15, 2009
Washington, DC in graphs
All these graphs are for DC proper, not the entire metro area.
The Federal Housing Finance Agency's House Price Index for DC. Note that it only measures homes with conforming mortgages. Also note that the index is not adjusted for inflation.

Washington, DC's homeownership rate. Notice it is below 50%.

Washington, DC's unemployment rate. It is higher than the national average, while the entire DC metro area's unemployment rate is lower than the national average. This suggests that people with better job prospects prefer to live in the suburbs.

Update: If you click on the graphs, they will now take you to the original source. Once there, you can click the "Customize with FRED Graph" link to customize them.
The Federal Housing Finance Agency's House Price Index for DC. Note that it only measures homes with conforming mortgages. Also note that the index is not adjusted for inflation.
Washington, DC's homeownership rate. Notice it is below 50%.
Washington, DC's unemployment rate. It is higher than the national average, while the entire DC metro area's unemployment rate is lower than the national average. This suggests that people with better job prospects prefer to live in the suburbs.
Update: If you click on the graphs, they will now take you to the original source. Once there, you can click the "Customize with FRED Graph" link to customize them.
Tuesday, July 14, 2009
The most affordable places to live
Money magazine is out with its list of "Best Places to Live 2009".
It also has a list of the most affordable places to live. (Think middle America.) And for those of you who really, really want to live in Arlington, Arlington is on the list.
It also has a list of the most affordable places to live. (Think middle America.) And for those of you who really, really want to live in Arlington, Arlington is on the list.
Monday, July 13, 2009
PMI Group: Expect more house price declines
This maps shows the risk of further house price declines for the country's metropolitan statistical areas. High risk is red; low risk is blue. Click on the image to see the full-sized version:
 The Wall Street Journal summarizes PMI Group's report:
 The Wall Street Journal summarizes PMI Group's report:
Nearly 85% of the country’s housing markets are facing an increased risk of home price declines over the next two years, and prices are likely to slide in half of the largest 50 U.S. markets through the beginning of 2011, according to a report from mortgage insurer PMI Group Inc.The report's highlights:
Rising unemployment is accelerating foreclosures and home price declines in a diverse group of markets that are likely to spread the reach of housing pain beyond the hardest hit four states–California, Nevada, Florida and Arizona. ...
“Probabilities of lower house prices in two years have risen significantly in MSAs as diverse as Kennewick, Wash., and Kokomo, Ind.,” the report says. The report doesn’t estimate the severity of those price declines.
* To date, the worst of the current downturn hit the economy in the fourth quarter of 2008 and the first quarter of 2009.According to the PMI Group report, the probability that the Washington-Arlington-Alexandria MSA will be lower in two years is 91.7%. The probability that the Baltimore-Towson MSA will be lower in two years is 89.6%.
* Rapidly rising foreclosure and unemployment rates, continuing declines in house prices, and weakening consumer demand all worked to drive risk higher in the general economy, as well as the housing market specifically.
* The risk of house price declines across many of the nation’s MSAs rose significantly during the first quarter.
* The increased risk of future house price declines is now largely being driven by rising unemployment and foreclosure rates (the latter adding to the unsold supply of homes).
* There are some signs of coming improvement, but it is still too early to say that we have reached the bottom in the market.
* Some of the positive elements appearing in the second quarter are:
1. Slowing rates of house price depreciation – prices are falling, but not as fast.
2. Unfortunately, unemployment continues to increase as payroll employment continues to decline, but each has slowed relative to their first quarter 2009 pace of deterioration.
3. Housing affordability continues to improve in response to the significant decline in house prices and still relatively low rates of interest.
Sunday, July 12, 2009
Pending home sales are an unreliable indicator
The Wall Street Journal says not to trust pending home sales as an indicator of actual future sales.
The National Association of Realtors is trumpeting a fourth consecutive monthly gain in their report of pending home sales. The index tracks the number of contracts signed on homes...
In the past those contracts would give a pretty good indication of what existing home sales would look like when the NAR reports its [sales] numbers a few weeks later. These days the report’s reliability as an indicator is shakier. More pending sales appear to be falling through, as financing becomes harder to reach or as buyers and sellers renege on pricing. ...
Indeed, for nearly a year, the pending home-sales index appears to be over-predicting closed sales relative to historical levels, notes independent housing economist Thomas Lawler.
Saturday, July 11, 2009
WSJ: A double-dip in the Case-Shiller index may be coming
The Wall Street Journal warns that a decline in high-end home prices may cause a double-dip in the S&P/Case-Shiller Home Price Index:
The pace of home price declines tracked by the S&P Case-Shiller home-price index slowed for the third straight month in April. But the bloodletting may not be over.
Here’s why: If price declines accelerate for the mid-to-upper end of the housing market, then that could generate enough large declines in values—even among a small segment of the overall housing market—to push the index lower still.
Prices at the mid-to-high end are falling as job loss and the worsening economy have iced demand for higher-priced “move-up” homes. Also, tougher financing conditions have made it harder to get mortgages for “jumbo” loans on more expensive homes, and delinquencies are rising among jumbo borrowers, which could lead to an even greater oversupply of homes.
Independent housing analyst Ivy Zelman notes that such a “double dip” in the index in the second half of 2009 could materialize because the Case-Shiller index is value-weighted, which means that repeat sales of higher priced homes figure have an outsized impact. ...
So far, prices have fallen from their 2006 peak by 33% at the middle of the market, compared to 44% at the low end and 27% at the high end, according to Ms. Zelman.
Friday, July 10, 2009
The recession is slowing household formation
The Washington Post points out the effect the recession is having on household formation:
The number of people setting up their own households has fallen to some of the lowest levels in a generation, a trend that threatens to prolong the recession.
Many people, young and old, who in more promising times would be out on their own, are finding themselves ... stuck at square one. ...
The recession has wreaked havoc on all sorts of life plans. Tumbling stock prices have cut retirements short. Layoffs have forced middle-aged children to move in with mom. Falling home prices prompt unhappy couples to rethink divorce. The larger consequence of all these discrete decisions is that Americans are forming fewer households, which in turn helps prolong the downturn.
Government data suggest that the recession has helped push down household formation. ...
Household formation rates could keep falling, said Richard Moody, chief economist for Forward Capital, a real estate investment and research company, because of the strong correlation between job loss and household formation. With unemployment not expected to peak until next year, "a lot of that isn't reflected yet" in the data, he said.
Thursday, July 09, 2009
Prime borrower delinquencies rising
This could cause higher-priced homes to fall more in value:
Mortgage delinquencies show few signs of slowing down, according to data from an industry-wide coalition of mortgage investors and servicers.According to the Chicago Tribune, the surge in foreclosures is likely to continue pushing prices down:
The number of mortgages that were 60 days or more late reached 5.65% in May, which makes for the highest level on record.... Foreclosure starts surged after pausing earlier this year as various states and lenders held back foreclosures through various moratoria. Some 257,000 homes entered the foreclosure process, up 5.7% from April and 34% from one year ago.
The May figures show how the housing market distress has eased for subprime borrowers while it continues to accelerate for prime borrowers. Subprime foreclosure starts fell by 16% from one year ago, even as prime foreclosure starts jumped by 83%. Housing analyst Ivy Zelman notes that an “incremental weakening in prime mortgages are likely to result in a pick-up in higher-priced foreclosures hitting the market in late 2009/early 2010.” That could put more downward pressure on the higher end of the housing market.
Just as the nation's housing market has begun showing signs of stabilizing, another wave of foreclosures is poised to strike, possibly as early as this summer, inflicting new punishment on families, communities and the still-troubled national economy.
Amid rising unemployment and falling home prices, mortgage loan defaults have surged to record levels this year. Until recently, many banks have put off launching foreclosure action on many troubled properties, in part because they had signed up for the home-stability plan from President Barack Obama's administration, which required them to consider the alternative of modifying loans to make it easier for borrowers to make payments.
But with many government and self-imposed foreclosure moratoriums expiring, the biggest lenders indicate they are likely to move more aggressively to clear a backlog of troubled mortgages.
Apartment vacancies are rising and rents are falling
From BusinessWeek:
Apartment vacancies in the second quarter rose to 7.5% — the highest percentage for that period in 22 years, according to today’s apartment market report from Reis.
It seems that people are moving in with friends and family, or are finding roommates.
Effective rents, which include concessions, fell 1.9% from a year earlier and 0.9% from the previous quarter.
Wednesday, July 08, 2009
How to hedge the value of your home
 Robert Shiller has a new way to bet on housing prices:
On June 30, MacroMarkets launched the first products that let investors make a pure directional bet on home prices. Called MacroShares, they trade on the New York Stock Exchange; their value is derived from changes in the Case-Shiller 10-city home-price index. If you expect home prices to rise, you'd buy the Up Metro Market (UMM); bears can buy the Down Metro Market (DMM). On the first day of trading the bears held sway: Investors bought 14,756 DMM shares, vs. only 6,204 of UMM.These are ETPs (exchange traded products). There are fact sheets about them here and here. These seem more friendly to small investors than the housing futures because they require a smaller minimum investment and you can buy them just like stocks.
"UMM and DMM will be the indicators that people will turn to when they want a snapshot of home-price sentiment," says Masucci. Shiller thinks they will have real practical value for homeowners. If you buy the DMM and the price goes down, the money you make on the investment will offset your lost home value. If prices go up, you lose money on the DMM, but your house will be worth more.
Tuesday, July 07, 2009
A look at key economic indicators
Here is a look a several important leading and coincident economic indicators. Leading indicators help forecast the future of the economy several months in advance. Coincident indicators reflect the current state of the economy.
Leading Indicators
The most reliable leading indicator is the slope of the Treasury yield curve. The slope is typically measured by the spread between the 10-year Treasury bond yield and the 3-month Treasury bill yield. An inverted yield curve (long-term rates lower than short-term rates) suggests a recession within the next year. Meanwhile, an upward sloping yield curve (long-term rates perhaps 1.0% or more higher than short-term rates) suggests a growing economy within the next year. I don't have a graph of the yield curve, but the spread is currently 3.33%, which suggests we are headed for a recovery.
New capital goods orders are a sign of a near-term recovery or decline. Here is the year-over-year percentage change.

New building permits are another leading indicator. Due to the fact that we still have a housing bubble, I don't expect permits to turn around before the recession ends. Expecting housing to lead us out of this recession is like expecting technology to lead us out of the 2001 recession.

Coincident Indicators
While leading indicators forecast the future of the economy and thus tick up before a recovery, coincident indicators reflect the current state and thus should not tick up until the economy is actually recovering.
Year-over-year non-farm payrolls are still dropping like flies.

Year-over-year industrial production is still plunging.

Yet the year-over-year change in consumer sentiment is surprisingly strong, probably caused by the recently rising stock market (or vice-versa).

Monday, July 06, 2009
Is the economic stimulus effective?
Back when President Obama was arguing for the fiscal stimulus package, his economic team created a graph forecasting the effects of the fiscal stimulus. The blue lines below show the expected unemployment rate with and without the fiscal stimulus. The maroon dots show the actual unemployment rate so far.
 The fact that the unemployment situation is substantially worse than expected didn't prevent President Obama from bragging back in late May that, "In these last few months, the American Recovery and Reinvestment Act has saved or created nearly 150,000 jobs."
It is impossible to empirically measure how many jobs have been saved, so the "saved or created" numbers Obama uses are complete fabrications based on the White House's own shifting macroeconomic estimates. No matter how bad things get, Obama can always claim—without evidence—that things would have been worse, therefore he saved jobs. The gullible news media have been falling for it.
That said, the bulk of the stimulus package takes effect in late 2009 and in 2010, so we should not expect it to have had much economic impact yet.
Update: Someone pointed out to me that I forgot to specify the source of the graph. The specific version of the graph I posted came from Harvard economics professor Greg Mankiw's blog. The original graph came from this document by CEA Chair Christina Romer. The unemployment information plotted on the graph can be found on the St. Louis Federal Reserve web site.
Saturday, July 04, 2009
ADP Employment Survey graph
Here is Automatic Data Processing's measurement of the monthly job losses during the recession. Compare this with yesterday's graph of the government's job loss numbers.

Unlike last month, ADP and the government are in close agreement this month. ADP says 473,000 job losses in June and the government says 467,000 job losses.

Unlike last month, ADP and the government are in close agreement this month. ADP says 473,000 job losses in June and the government says 467,000 job losses.
Friday, July 03, 2009
Job losses jump
Job losses and the unemployment rate are key signs of economic decline or recovery. There is mixed news on the employment front. Job losses jumped unexpectedly, but the rate of increase in the unemployment rate slowed:
 The unemployment rate over the past five years:
 The reason they can disagree is because they are measured differently. The job loss number is probably more reliable than the unemployment rate.
The battered U.S. labor market took a step backwards last month as employers trimmed more jobs from their payrolls in June, according to a government report Thursday.Job losses since the recession began:
There was a net loss of 467,000 jobs in June, compared with a revised loss of 322,000 jobs in May. This was the first time in four months that the number of jobs lost rose from the prior month.
The June job losses were also far worse than the forecast of a loss of 365,000 jobs by economists surveyed by Briefing.com.
The unemployment rate rose for the ninth straight month, climbing to 9.5% from 9.4%, and hitting another 26-year high. Economists had been expecting that the unemployment rate would hit 9.6%.
Nearly 3.4 million jobs have been lost during the first half of 2009, more than the 3.1 million lost in all of 2008.
The unemployment rate over the past five years:The reason they can disagree is because they are measured differently. The job loss number is probably more reliable than the unemployment rate.
Thursday, July 02, 2009
A Blast from the Past (2005)

Cheesy Ad from Mortgage Company. [October 2005]

Powerpoint Slide from the California Assocation of Realtors [Fall 2005]
Wednesday, July 01, 2009
Sheila Bair tried to sell her home
 From The Wall Street Journal:
Sheila Bair, the chairman of the Federal Deposit Insurance Corp., takes her 14-room home in Amherst, Mass., off the market after cutting its sale price by $100,000. She had originally listed it for $795,000 in April. Ms. Bair and her husband, Scott P. Cooper, bought the 1860s house in 2002 for $355,000. The home has five bedrooms, new roofing and a counter-current basement pool.Since both Sheila Bair and Tim Geithner have recently tried and failed to sell their homes at unreasonably high prices, do they have a conflict of interest regarding the housing bust and financial crisis? Do they have an incentive to use the powers of their offices to prop up prices?
Americans unenthusiastic about financial benefits of homeownership
This news is actually about a week old, but I've been slow:
The long-held belief (some call it a myth) that homeownership is a sure-fire ticket to building wealth and equity might be changing, according to a recent survey from the National Foundation for Credit Counseling.This is typical rear-view mirror thinking. Although the bubble has not vanished, prices are definitely better than when everyone was going gaga four years ago.
Nearly half of those surveyed no longer think owning a home is a realistic tool to build wealth.
Consider it a by-product of the housing crisis, as millions of Americans face plunging home values leaving many stuck with a house worth less than the mortgage. ...
“It appears that whether a person was directly affected or not, Americans’ attitudes toward homeownership have shifted,” said Gail Cunningham, a spokeswoman for the nonprofit credit counseling organization.
Subscribe to:
Posts (Atom)


