Tuesday, June 08, 2010

Friday, June 04, 2010
Initial jobless claims stuck so far this year
Initial jobless claims numbers seem to be stuck this year, but they're still much better than a year ago. This graph shows the year-over-year percentage change over the past five years (lower is better).

Today's payroll numbers are expected to show lots of new jobs were created in May. The payroll data probably will have been released by the time you read this (assuming you read this blog at work).
Update: It turns out that the numbers were not nearly as good as expected:

Here is the year-over-year percentage change in aggregate weekly hours worked:

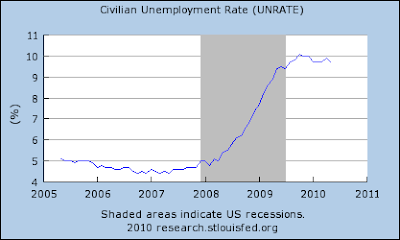
Here is the official unemployment rate:

Today's payroll numbers are expected to show lots of new jobs were created in May. The payroll data probably will have been released by the time you read this (assuming you read this blog at work).
Update: It turns out that the numbers were not nearly as good as expected:
A flood of temporary Census workers in May led to the biggest jump in jobs in ten years, the government reported Friday.Here is the year-over-year percentage change in payrolls:
Employers added 431,000 jobs in the month, up from 290,000 jobs added in April. It was the biggest gain in jobs since March 2000.
But Census hiring was responsible for 411,000 of May's increase in employment. Private sector employers also added 41,000 jobs in the period, well below the 218,000 private sector job gains in April. Government payrolls other than Census declined by 21,000 jobs in May, due largely to job cuts by state and local governments.
It was a disappointing number for private sector hiring, as economists surveyed by Briefing.com had forecast an overall gain of 500,000 in May. U.S. stocks traded sharply lower on the report, with the Dow Jones industrial average down more than 200 points in midday trading. ...
Despite the spike in hiring, the unemployment rate declined only modestly, to 9.7% from 9.9% in April. Economists had forecast it would decline to 9.8%.

Here is the year-over-year percentage change in aggregate weekly hours worked:

Here is the official unemployment rate:

Tuesday, June 01, 2010
IMF economist: home prices have much more to fall
IMF economist Prakash Loungani is not exactly optimistic about global (or U.S.) housing prices:
International Monetary Fund economists Prakash Loungani has found plenty of reasons to remain glum.
Loungani, at a National Economists Club luncheon in Washington Thursday, presented his analysis of housing busts since 1970 in the countries that make up the Organization for Economic Cooperation and Development. His prediction: Home prices will fall much farther and for much longer.
On average, the previous housing slumps lasted 18 quarters, with prices dropping 22% from peak to trough. By contrast, the current housing slump has lasted only 14 quarters, during which prices have dropped just 15%.
But the latest boom was so much bigger than the previous ones that it’s logical to anticipate an even more brutal downturn, Loungani argued. Prices rose 113% over 41 quarters, compared with 39% average price increase over 39 quarters seen in the previous booms. ...
Loungani said his analysis of prices and rents in U.S. metro areas suggests that many markets on the West coast and in parts of the Northeast could yet see prices plummet a further 30-40%.
Friday, May 28, 2010
The prospects for housing
Here's how The Economist sees the outlook for the U.S. housing market:
With home prices falling once more, recovery in housing markets could be farther off than anticipated, and residential investment could prove more of a [economic] drag than initially foreseen.They have more here.
U.S. national debt hits $13 trillion
The U.S. Total Public Debt has hit a new record:
Here's a graph of Federal Debt Held by the Public as of year-end 2009:

The U.S. national debt has passed the $13 trillion mark, according to USDebtClock.org, an independent website that tracks the real-time growth of U.S. revenues and spending.Federal Debt Held by the Public, a better measure of the national debt because it doesn't count money some parts of the government owe to other parts of the government, is just shy of $8.5 trillion according to TreasuryDirect.gov. To put things in perspective, that's $75,973 per U.S. household.
On Tuesday, the national debt stood at $12,995,779,490,444.52, according to the Treasury Department's national debt-tracking website TreasuryDirect.gov.
Here's a graph of Federal Debt Held by the Public as of year-end 2009:

Thursday, May 27, 2010
S&P/Case-Shiller HPI down 3.2% in Q1
Sorry about the delay in posting this:
Speaking of the tax credit:
Home prices fell in the first quarter of 2010 but are still higher than they were a year ago.Government intervention paused the fall in housing prices over the past year, but now that the tax credits are gone I expect the free market to continue pushing prices lower.
According to the S&P/Case-Shiller nation-wide index, home prices fell 3.2% quarter-over-quarter but have still managed to climb 2% year-over-year.
The index continued to show weakness despite very low mortgage interest rates and tax incentives to encourage home purchases. ...
"The housing market may be in better shape than this time last year; but, when you look at recent trends there are signs of some renewed weakening in home prices," says David M. Blitzer, chairman of S&P's index committee.
Brad Hunter, who follows the housing market for Metrostudy, a consulting and data-providing company, is predicting further price erosion along the lines of 10% or so before the market fully bottoms out.
Speaking of the tax credit:
New home sales soared in April as homebuyers rushed to claim the tax credit that expired at the end of the month.Now that the tax credit has expired, the temporary boost in home sales is likely over. After all, who wants to be the sucker who buys his house on May 1?
New home sales climbed 14.8% to a seasonally adjusted rate of 504,000 last month, up from an upwardly revised 439,000 in March, the Census Bureau reported on Wednesday. Sales year-over-year were up 47.8%. ...
April was the second straight month of increases. In March new home sales snapped a four-month losing streak and surged at the fastest single-month rate in 47 years as homebuyers snatched up properties ahead of the looming deadline for the tax credit.
The homebuyer tax credit, which expired April 30, boosted sales since buyers had to sign contracts by the end of last month.
Tuesday, May 25, 2010
Fortune: Housing not recovering
Fortune Magazine argues that housing isn't really recovering:
Americans purchased homes at a surprising clip in April, but don't let that fool you into thinking the housing market is back.
Although economists were expecting a month-over-month increase of 5.5%, the National Association of Realtors reported yesterday that sales of previously owned homes rose an unexpected 7.6%. That continued a yearlong rise in housing activity and marked the highest number of sales recorded since November of last year.
It also follows a drumbeat of similarly rosy economic news signaling the possibility that the United States may be on the economic mend. ...
But prospective home buyers, particularly those tempted to think of real estate as an investment again, should tread with caution. One critical obstacle to a housing recovery remains intact: supply. Until the number of empty homes starts to shrink, prices could still fall further.
Moreover, notes Joseph Foudy, a professor of economics and management at NYU's Stern School of Business, we're coming off of an artificial bump from the first time home buyer credit, which expired last month. ...
Many defaults have yet to be figured into the housing market because banks are sitting on them or they are being held back due to government programs like the federal Home Affordable Modification Program. ... At some point these homes will go on the market, further depressing prices.
Monday, May 24, 2010
Economic outlook good
The National Association for Business Economics sees good economic growth ahead:
To put things in perspective, here's a graph of real GDP vs. potential real GDP:

Luckily, real GDP is currently growing faster than potential real GDP, which is needed if we want the economy to get back to normal.
The U.S. economy should expand at a solid pace this year and next as consumers increase spending, confident the recession is behind them, a panel of economists said in a survey released Monday.Judging by the slope of the Treasury yield curve, I too expect decent economic growth over the coming year. That said, the economy fell so far during this recession that it will take a long time to get back to potential GDP.
The 46 economists surveyed in the National Association for Business Economics report between April 27 and May 7 predicted U.S. gross domestic product would expand by 3.2% in 2010 and 2011.
That is a touch higher than the 3.1% growth predicted for both years in the last survey, released Feb. 10.
"Although risks involving Europe have recently escalated, the outlook in this country has improved in most respects," said NABE President Lynn Reaser, chief economist at Point Loma Nazarene University.
"Growth prospects are stronger, unemployment and inflation are lower, and worries relating to consumer retrenchment and domestic financial headwinds have diminished," she said.
To put things in perspective, here's a graph of real GDP vs. potential real GDP:

Luckily, real GDP is currently growing faster than potential real GDP, which is needed if we want the economy to get back to normal.
Subscribe to:
Posts (Atom)

 Posts


