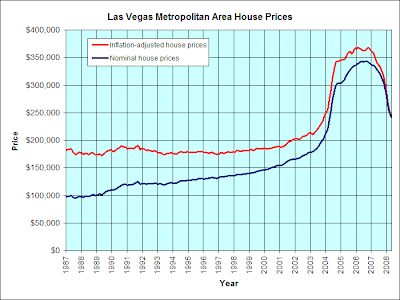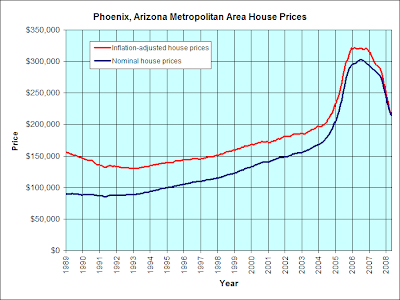
 Source.
Do any readers live in the American Southwest?
Bubble Meter is a national housing bubble blog dedicated to tracking the continuing decline of the housing bubble throughout the USA. It is a long and slow decline. Housing prices were simply unsustainable. National housing bubble coverage. Please join in the discussion.
Goodness, that's a steep rise! I'm only happy to see it plunge down, but how long is that likely to continue? If anybody has any predictions, let me know. I'm curious as to how this should affect our market in Canada...
ReplyDeleteYour friendly Toronto real estate agent,
Elli
LV prices going back to 1989 inflation adjusted prices. (assuming 5% inflation avg for three 3 years and another 10% nominal price drop)
ReplyDeleteThose curves seem to only have data through March or April. The past few months will almost certainly show more declines..
ReplyDeleteAnonymous said...
ReplyDelete"Those curves seem to only have data through March or April. The past few months will almost certainly show more declines.."
The charts show prices through April. However, the most recent month with data available is May, so the charts are only missing a single month. A single month's worth of price changes is so small that I decided it was only worth updating the graphs on a quarterly basis.
For the record, Phoenix nominal prices fell 2.4% from April to May, while Las Vegas prices fell 2.9%.
I wasn't ripping on you for having old data, really just making an observation.
ReplyDeleteMy point is that May, June and July are done with - we just don't have the data yet, but the anecdotal evidence is that there will be further declines. We just don't quite know what they are yet.
Anonymous said...
ReplyDelete"I wasn't ripping on you for having old data, really just making an observation."
My bad.
"My point is that May, June and July are done with - we just don't have the data yet"
No, no, no. Lance and the other housingheads are right. The market hit bottom in April and will now skyrocket forever. ;-)
Is Denver in the SW? Prices are going back up here. May just be a seasonal blip, but it feels like we've passed the trough.
ReplyDelete"Anonymous said...
ReplyDeleteIs Denver in the SW? Prices are going back up here. May just be a seasonal blip, but it feels like we've passed the trough."
Futures market (i.e. those willing to put money on it instead of us pussy anonybloggers) says you are right. Denver is in for 1-2 more years of up summers and down winters with the overall trend being modest downward.
They also say the rest of the western markets have 1 more year of huge declines ahead - just a little less steep than they are now. Eastern markets bottom this winter and then bounce for the next few years.
Anonymous said...
ReplyDelete"Futures market (i.e. those willing to put money on it instead of us pussy anonybloggers) says you are right. Denver is in for 1-2 more years of up summers and down winters with the overall trend being modest downward.
They also say the rest of the western markets have 1 more year of huge declines ahead - just a little less steep than they are now. Eastern markets bottom this winter and then bounce for the next few years."
The futures markets are basically useless beyond the next three quarters, because they are so thinly traded. For example, right now Denver futures show 113 for Nov 2010, 119 for Nov 2011, and 111.6 for Nov 2012.
Probably so. But within that 3 quarter lens, I do wonder about the begining of the bottom this winter and the summer bounce they see for Chi, LA, Mia, SD, SF & DC.
ReplyDeleteThe futures markets have been seeing that winter floor and spring bounce (albeit a dead cat bounce) for a while now, and if anything the recent trend is for them to go more positive than negative.
I find it interesting too that they are becoming even more negative on NY and LV - what do they see there that they dont see in the other places - job loss?
Anonymous said...
ReplyDelete"Probably so. But within that 3 quarter lens, I do wonder about the begining of the bottom this winter and the summer bounce they see for Chi, LA, Mia, SD, SF & DC."
That "summer bounce" you're seeing is bad data. The long-term contracts are too thinly traded to be any use whatsoever.
Keep in mind, also, that each contract expires two months after the end of the quarter, so the November 2008 contract actually represents prices in summer 2008 (July, August, and September).
I'm not going to go through all cities you mentioned, but here are the numbers for Washington, DC:
Q1 2008 Actual: 202.34
Q2 2008 Future: 196.00 (no spring bounce)
Q3 2008 Future: 185.00 (no summer bounce)
Q4 2008 Future: 173.80
Q1 2009 Future: 206.60 (bad data)
Q2 2009 Future: 206.80 (bad data)
Q3 2009 Future: 169.80
Q4 2009 Future: N/A
Q1 2010 Future: 197.40 (bad data)
Q2 2010 Future: N/A
Q3 2010 Future: 165.00 (bad data)
Q4 2010 Future: N/A
Q1 2011 Future: 165.00 (bad data)
Q2 2011 Future: N/A
Q3 2011 Future: 195.80 (bad data)
Q4 2011 Future: N/A
Any intelligent person can recognize that the Q1 2009 future is bad data because housing prices don't bounce by 19% in a single quarter.
You can also recognize bad data by the huge spread between the bid and ask prices for a given contract. For example, the Q4 2008 contract (February 2009) has a bid/ask spread of $12.60. The very next contract, Q1 2009 (May 2009), has a bid/ask spread of $140.00! That huge spread means nobody is seriously bidding on those contracts.
Any intelligent person can recognize that the Q1 2009 future is bad data because housing prices don't bounce by 19% in a single quarter.
ReplyDeleteWhy isnt that just seasonality - similar to the rise & fall of median prices? As incredibly as it may seem, especially since we are talking about same house sales, Calculated Risk came to the conclusion that Case Shiller rises & falls over the course of a season.
anonymous said...
ReplyDeleteWhy isnt that just seasonality - similar to the rise & fall of median prices?
I've got a lot of historical housing graphs on my web site. There is no example, historically speaking, of housing prices jumping 19% in a single quarter. There is a wavy pattern of seasonly-changing prices, but not 19%.
And again, the Washington, DC May 2009 future contract's $140 bid/ask spread is further evidence of bad data. Take a look at cities (such as San Francisco) that don't have such enormous bid/ask spreads for May 2009, and you will see that they don't have the "bounce" you are claiming.