Many of us are familiar with the idea of a P/E ratio for a stock. This is the ratio that shows us how much we are paying for each $1 of earnings of a company. As an example, GE is trading at $33.20 with a P/E ratio of 21.70. This means that you are paying $21.70 for every dollar in earnings that GE makes. The P/E ratio has been a traditional indicator for when to buy a stock. The lower the P/E the better is the logic here.
Many people who invest in real estate have a similar idea with a Real Estate P/E Ratio. An RE P/E ratio is determined by taking the price of your home and dividing it by what it would rent for. Now obviously you can’t just take the actual price of your home and divide it by the monthly rent. What you normally do is take the total monthly carrying cost of a property and come up with a monthly total of ownership. (20% down payment, 30 yr mortgage, taxes, and insurance) Then you can divide this number by what you can rent the property for monthly. A simple example would be a 1 bedroom condo that costs $100,000. You put 20% down. And the total monthly payment would be somewhere in the neighborhood of $1,000 per month. (Mortgage, Tax, Insurance around $750 and Condo fee of $250) (In 2000 I owned a condo and this was my approximate payment). This 1 bedroom would have rented for about $1200 per month at the time. So the P/E ratio would have been $1,000/$1,200 = 0.833. Let’s look at this same 1 bedroom in today’s market. The price now is $300,000. 20% down is $60,000. Finance $240,000 for 30 years at 5.75% = $1,400.57 per month, plus taxes, insurance, condo fees = $1,800 per month. (I’m being generous here. It would actually cost more then this.) This condo would rent for approximately $1,400 per month now (Check for 1 bedrooms in Glover Park, DC). So the P/E would be $1,800/$1,400 = 1.286. Notice that the lower the number the better. If the number is above 1 you are in the negative. If it is below 1 you will make some positive cash flow on the investment.
My next goal was to come up with a way to track the real estate P/E ratio for the DC metro area as a whole. This would give me an idea of when the market made sense to invest. That is how I came to this RE P/E DC Ratio. The price is the Office of Federal Housing Enterprise Oversight House Price Index. (http://www.ofheo.gov/media/pdf/hpimsa_05q3.xls). They have broken out housing prices by the metropolitan areas from the census. For DC they go back to Q3 1975. This number is an index number that started at 100 in Q1 1995. The earnings number comes from the CPI. (http://www.bls.gov/data/home.htm)
The Bureau of Labor Statistics keeps consumer price index information for metropolitan areas as well. One number they keep is called the “Owners' equivalent rent of primary residence”. They started this for DC in Dec 1997 at 100. The Owners’ equivalent rent of primary residence is a unit of the CPI (representing 20% of the total CPI) that tracks how much houses would cost to rent. It represents the best number that we have to give us a solid basis for how much rents are in an area.
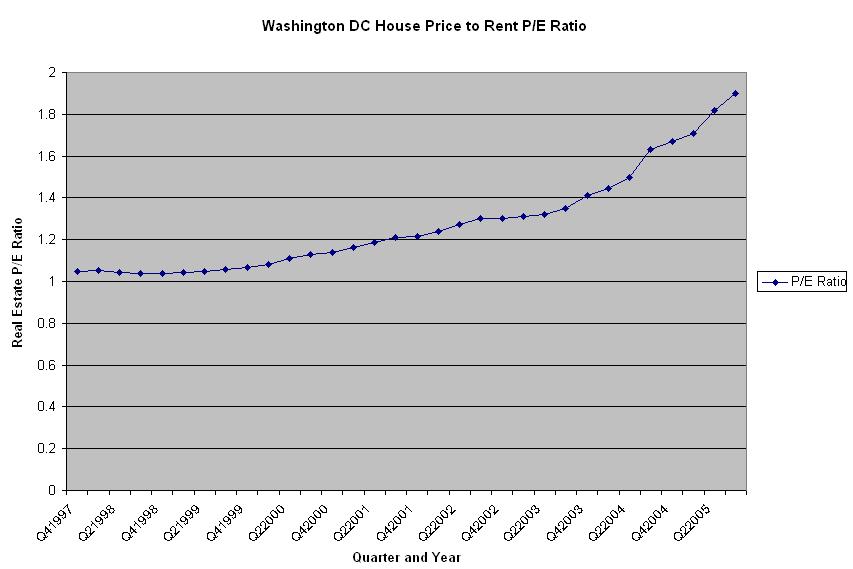
We can use the DC RE P/E Ratio to give us an idea of how overall prices and rents are interacting within the DC metro area market. This dramatic increase in P/E means that housing prices have been increasing much faster then rents. It seems that now would be a very bad time to buy an investment property. We will have to wait until either condo prices drop or rents rise significantly in order to be able to get a better (or any) return on our investment.


>> Now obviously you can’t just take the actual price of your home and divide it by the monthly rent.
ReplyDeleteActually you can. You'd want to use annual rent not monthly, and ideally substract maintenance and insurance out of the rent before dividing.
Voila, there you have a P/E ratio, and it is on the same scale as your other investments.
Eric,
ReplyDeleteA great piece of work - well done.
I have one quick comment. In your first numerical example, it looked like you excluded the 20 percent and just calculated the housing cost from the loan on the 80 percent. I would respectfully suggest that you should include the foregone interest on the 20 percent.
Having said that, using the HPI and the rental index seems to correct for this minor point.
Again, congratulation on a very useful piece of analysis.
returntodc
Wonderful work!! I am wondering about the following question.
ReplyDeleteAs you have defined the RE P/E ratio; at a RE P/E ratio of 1 there is no real economic distinction between renting and owning. For the RE P/E ratio significantly higher than 1, it obviously makes more sense to rent than to own. This implies a built in equilibrium tendency; as the cost of ownership becomes more uneconomical more people would rent bringing the ratio back towards 1.
Why then has the ratio increased by almost a 100% and continued to increase for a good 6-7 years? If this is because the basic economic justification is forgotten in the hope of finding a bigger fool; then wouldn’t this be a “bubble” by definition?
" If this is because the basic economic justification is forgotten in the hope of finding a bigger fool"
ReplyDelete1) Speculative episode
2) Lower interest rates
3) Easy Credit
Keep in mind, however, that the above formula is set on Condo rental rates (which also have a much lower rate of return on the open "for sale" market). And, not all real estate investors invest purely for the short-term monthly cash flow. Take, for instance, that a long term rate of return on your 20% down and approximately 2% out of pocket investment spread over the course of 12 months (the difference between your monthly rental income vs. what you owe), and historically spread that over the course of so many years, the rate of return superceeds that of a savings account, money market account, cd rates, or very conservative investing -- HOWEVER, with all but the investing, each of those options are GUARANTEED.
ReplyDeleteIf you save your graphs as .gif files they will compress more and not have those funny halos around the edges when you view them at 100%. JPG files are better for photographs or images with a variety of colour gradients.
ReplyDeleteanon 6:05,
ReplyDeleteThanks for the advice. I'll do as suggested
You might include depreciation of the property as well. If you believe properties are overvalued (which I do) and there will be a short term correction of 3-7% in the next year then 300K condo today might be worth 285K next year. So you are losing about $1100 a month on depreciation of a $300K condo. That would really mess with your P/E.
ReplyDeleteI'm glad I sold my house on 1st st nw when I did. Paid well over $200K for house where no quality of life exists. Now I'm in Montreal, paying $700 per month and have all the quality of life I could ever want.
ReplyDeleteI am a renter in a
ReplyDelete$2300/mo townhome near San Diego. I know that the landlord uses my rent toward the mortgage but I'm not sure if he's profiting. Given the "bubble" how can I find out if I'm being overcharged so he doesn't take a loss? He bought it just before leasing it to me for one year. When the lease is up in August, will I be able to negotiate new terms for future years since he may feel nervous about prices falling/me leaving?
Whether or not your landlord is porfiting really has nothing to do with you or the price. Prices should be set based on demand. Most landlords in areas like SF or SD are not recovering the cost of a new mortgage + HOA dues + upkeep + property taxes (on a new mortgage.) Of course if he bought the property 40 years ago and it's paid off then he's got no mortgage right? So if you want to know if you're paying too much go look at craigs list and see if you can do better.
ReplyDeleteThe P/E ratio as illustrated here is incorrect. In the same way as used in any other investment calculation, the total outlay must be used not the "monthly cost of ownership". The above calculation lead to P/E ratios that are far lower than they actually are.
ReplyDelete