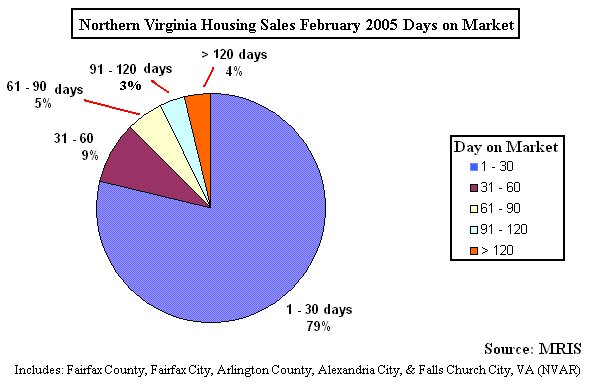
Generally, in February 2005 housing units that did sell had been on the market a relatively short period of time. A full 79% of houses that sold in February 2005 in Northern Virginia had been on the market for 30 days or less.
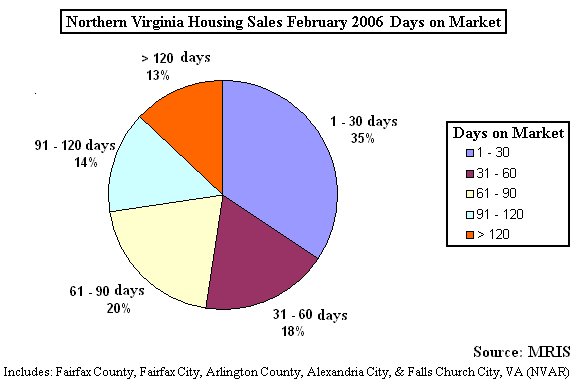
During February 2006, 35% of houses that sold had been on the market for between 1 - 30 days. Houses are sitting on the market longer and longer.


Additionally, the number of housing units sold in February 2005 was 1718. In February 2006, the number of housing units sold was 1368 , which represents a 21% fall in sales from the last year.
ReplyDeleteVery interesting stats. What a difference 1 year makes. I would like to see stats showing differences between asking price and selling prices 2005 compared to 2006.
ReplyDeleteI wish someone would create a site like this for Baltimore!
ReplyDeleteWow! Amazing how some markets are shifting. We aren't seeing a massive slowdown here in Boulder. Comparing 2005 and 2006 for December, January, and February (note our market is massively smaller, but many insist there's a bubble here too):
ReplyDeleteSingle Family Homes
Attached Dwellings
Check it out.
It will be interesting to see what happens this spring.
ReplyDeletewww.dcbubble.blogspot.com
Interesting 15 yrs inventory charts for Northern Virginia at:
ReplyDeleteMcEnearney.com
go to Market Watch. They also have DC and MD.
Looking at the charts, the current inventory does not seem so scary.
I am a big believer that there is a massive bubble here in the DC area.
ReplyDeleteI have seen lots of houses and condos sitting on the market for a long time around me.
However, I haven't seen an explosion in inventory yet.
It has exploded off of the past couple of years - but if you look at the historical inventory charts, the past 2 or 3 years were an anomaly.
ReplyDeletemrmajor,
ReplyDeleteShould be out tommorow according to my inside contacts at NVAR.
These graphics try to mislead you in two ways: one, the use of separate pie charts doesn't allow you to see the sharp relative increase in days on market. two, by plotting % instead of actual number of homes, they are also hiding the absolute extent of the bubble. That data plotted on a bar graph would be more striking than these nice round circles.
ReplyDeleteI actually made the pie charts. I admit having bar charts might be more effective.
ReplyDeleteI think there's a bubble too, but to be honest, these numbers aren't showing it all that convincingly. Can we compare these to DOM from 1997 or so? And what about inventory? And of course we won't really know until later in the spring, since February is usually pretty quiet. I can't imagine all the new condo inventory in NoVA can help but shove prices way down, but what do I know?
ReplyDeleteAnd another question - what do rising ARM rates have to do with things? I know it'll shave a few percent off of the first-time homebuyers, but that can't be that big a factor anymore. Do you suspect it'll cause a spike in foreclosures? Force flippers to jump ship? Again, I don't really know that it's going to have that big an effect.
ReplyDeleteDavid, what time does NVAR usually post its data? Anxiously awaiting it, since your source said it was coming today! Did your source also give any hints as to what the data will look like?
ReplyDeleteMy prediction - sales basically stagnant from January, prices off 5%, inventory still exploding.
My source said "morning" No hints from my source as to what the data will look like.
ReplyDelete"morning," eh? guess they're late - it's now 12:30 and no update yet. or is there something in the data they're reluctant to let everyone see?
ReplyDeleteWhat about sellers' attitude?
ReplyDeleteSince I suspect many sellers are holding out in disbelief of a market correction, they are artificially extending DOM.
I agree the rising short term rates have taken some of the wind from the investors sails but a ratified contract needs a seller willing to accept market pricing reality.
Anon 3:23 and Dorothea,
ReplyDeleteThose numbers at McEnearney need clarification. I have written to them and asked. There are currently nearly 5,000 listings in Fairfax County alone, but they are calling their numbers "Northern Virginia" numbers. At http://wwwv.virginiamls.com, the total listings for Northern Virginia for 3/14/06 (Alexandria City, Arlington County, Fairfax City, Fairfax County, Falls Church City, Loudoun County, Manassas City, Manassas Park City, and Prince William County) is 13,177.
The Virginia February sales data is available at www.mris.com (Stats section). I find it a cleaner way to read the data for each county than from NVAR anyway.
ReplyDeleteI don't see the "new" condos reflected in the inventory. These big developments are not in the MLS. So, are they in the inventory numbers?
ReplyDeleteAnd, if not, it seems to me that these new condos and conversion represent a huge amount of hidden inventory. Much more so than the early 90's.