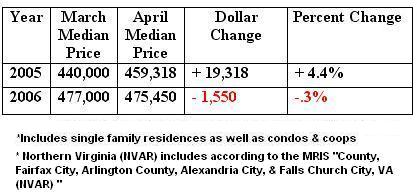
 In Nothern Virginia, the 2006 spring selling season has been very weak. Whereas, in 2005 median selling price rose 4.4% from March to April, in 2006 median prices fell .3% between those same two months.
Historically, March and April are very strong months for median price growth. If the median price numbers are declining or basically stable in the spring season, it will most probably mean large price declines in the weaker fall and winter months.
These are the Virginia inner suburbs of Washington, DC. Statistics from the Metropolitan Regional Information Systems, Inc (MRIS).


-0.3% month to month is a "real bummer"? hahah, you're getting desperate for bubble news.
ReplyDeleteDavid,
ReplyDeleteThis tells me that the RE market has leveled off. However, the big crash has NOT happened. A bubble pops when you have a significant depreciation in prices.
Right now when I look at these figures, the bubble has NOT popped...it's just shrinking. A 0.3 percent monthly change doesn't give housing-heads or bubble-heads much direction. Let's wait for the May and June figures to get a better barometer of things.
"A 0.3 percent monthly change doesn't give housing-heads or bubble-heads much direction."
ReplyDelete1) It is one month.
2) It is during the spring season. When last year median prices were up 4.4% and now down .3% which is 4.7% swing.
"1) It is one month.
ReplyDelete2) It is during the spring season. When last year median prices were up 4.4% and now down .3% which is 4.7% swing"
So desperate for bubble news. I love it. You're in a tailspin.
Deniers still must not understand the concept of throwing a ball into the air. After rising it slows till it stops briefly, then slowing begins accelerating back to earth. Crowing about the bubble not bursting yet is like throwing a ball into the air and saying "see its not coming back down" just as it reaches its peak.
ReplyDelete"Deniers still must not understand the concept of throwing a ball into the air. After rising it slows till it stops briefly, then slowing begins accelerating back to earth. Crowing about the bubble not bursting yet is like throwing a ball into the air and saying "see its not coming back down" just as it reaches its peak. "
ReplyDeleteYeah, because we're talking about throwing a ball up into the air. Maybe you should start a blog on throwing balls into the air because here's it's just a worthless, false analogy.
It is not a worthless analogy. Price momentum has stopped and begun to slow. This did not happen last year.
ReplyDeleteI find those facts interesting. Combined with rising inventory, it does tell me something.
A Redskins fan
All the bubble poppers I know of, no exception, wrote that housing bubbles don't pop in a week - they're not like stock, which are so liquid that the entire market can drop 30% in 2 days.
ReplyDeleteThey all wrote that if and when this housing bubble pops, it will take months - prices will not drop off a cliff in a day.
The deny-ers are really something else - they're putting words in people's mouths, then stomping up and down and shouting because those (manufactured by the deny-ers) words are wrong.
So now, prices are not dropping off a cliff in a day EXACATLY LIKE THE BUBBLE POPPERS PREDICTED, and the bubble deny-ers are out in force saying
THE POPPERS WERE WRONG !!!!!!!
THE POPPERS WERE WRONG !!!!!!!!!!
The poppers were not wrong - you deny-ers are just clueless about what they wrote.
Or you are simply lying.
"It is not a worthless analogy. Price momentum has stopped and begun to slow. This did not happen last year.
ReplyDeleteI find those facts interesting. Combined with rising inventory, it does tell me something.
"
It is a false analogy - the laws of physics, including gravity and inertia, are working on a ball thrown into the air. Last I checked, gravity and inertia have nothing to do with real estate markets.
What goes up must go down.
ReplyDeleteA reversion to the historical mean in relation to fundamentals (ie incomes and rents) is not a matter of "if" but "when."
ReplyDelete"A reversion to the historical mean in relation to fundamentals (ie incomes and rents) is not a matter of "if" but "when." "
ReplyDeleteNo, it's a matter of "if," not a matter of "when."
"A reversion to the historical mean in relation to fundamentals (ie incomes and rents) is not a matter of "if" but "when." "
ReplyDeleteI guess it's easier to come up with catch phrases than to make a logical point based no facts and reason. Maybe you should forget real estate and try to catch on with a bumper-sticker company?
I really enjoy your website, and I really appreciate you shinging some light on a lot of this kind of data, but I think that characterizing this chart as evidence of 'bubble bursting' is a bit premature:
ReplyDelete1) the 'percent change' column mischaracterizes the actual size of the change. If you think of the 440K in March 2005 as an investment, and see that it has gone up to 459k in April, that is increasing at an annualized 67.5% rate. (similarly, the -0.3 rate underrepresents the annualized decrease). So it's not too surprising that this rate has slowed down.
2) The YOY March-to-March increase is 8.4% and the YOY April-to-April increase is 3.5%. To me, YOY prices need to be coming down before you can claims 'bubbles burst.' While its significant that month-to-month prices have declined, I won't be convinced of any bubble until I start seeing some declining YOY prices.
I would also be interested in knowing the quantity of houses that have sold at these prices.
"If the median price numbers are declining or basically stable in the spring season, it will most probably mean large price declines in the weaker fall and winter months."
ReplyDeleteIs this your opinion? Sounds a lot like the other "what goes up must come down" slogans trotted above. My advice (and I'm no expert) is that future real estate market prices are based upon slightly more complex fundamentals.
"Is this your opinion? Sounds a lot like the other "what goes up must come down" slogans trotted above. "
ReplyDeleteAll economic trends are based on who has the catchiest slogans. It's why this site is so successful.
"The YOY March-to-March increase is 8.4% and the YOY April-to-April increase is 3.5%. To me, YOY prices need to be coming down before you can claims 'bubbles burst.' "
ReplyDeleteA YOY increase of 3.5% is probably less than inflation, so in real terms, perhaps prices are down.
A Redskins fan
"A YOY increase of 3.5% is probably less than inflation, so in real terms, perhaps prices are down."
ReplyDeleteBut certainly up from March to March.
""The YOY March-to-March increase is 8.4% and the YOY April-to-April increase is 3.5%. To me, YOY prices need to be coming down before you can claims 'bubbles burst.' "
ReplyDeleteA YOY increase of 3.5% is probably less than inflation, so in real terms, perhaps prices are down."
But only April over April 2005. The most you can say from that is that there was a blip last April that didn't take. The substantial March to March gains are intact. This information doesn't support the bubble theorists.
May YoY appreciation will be less then inflation or even nominal dollar negative
ReplyDeleteA logical point to consider:
ReplyDeleteNo portion of the economy can have a long term growth rate above GDP. If it did, it would eventually become a large percentage of GDP and eventually become the entire economy. At which point, the GDP would begin tracking the single portion of the economy you're looking at.
Based on this, I would expect housing price appreciation to revert to it's long term growth rate of a percentage or 2 above inflation. I also expect pricing to shoot past this equilbrium (aka we will see contracting/decling prices) as the growth rates revert to this historical average.
My $0.02.
The trend is the key here not the YoY prices. If you don't think a trend is emerging now is a good time to buy so have at it.
ReplyDeleteTo those who think we're having a "soft landing", I ask -
ReplyDeleteHave you ever paid attention to the trajectory of a ball that is thrown - the steeper it goes up, the faster it comes back down, whereas if it rises much slower, it also seems to travel longer and falls slower.
This -0.3% means we are just back the halfway point in our travels, it's all downhill from here.
Think of the St. Louis Arch - beautiful, isn't it?
look at SFHs in Arlington...
ReplyDeletehttp://www.nvar.com/market/marketstats/apr06/arsf0406.PDF
the graph at the bottom shows they are down YOY (both average and median). those million dollar homes sitting an extra month may start dropping in price pushing them into the lower bracket, "buy more house for your money" mentality hits that bracket, the houses orginally in that bracket tumble to the next lowest bracket, and so on and so forth...
beautiful man, f'ing beautiful.
"May YoY appreciation will be less then inflation or even nominal dollar negative "
ReplyDeleteSource? This is an empirical fact. Surely you have a source, David?
"To those who think we're having a "soft landing", I ask -
ReplyDeleteHave you ever paid attention to the trajectory of a ball that is thrown - the steeper it goes up, the faster it comes back down, whereas if it rises much slower, it also seems to travel longer and falls slower.
This -0.3% means we are just back the halfway point in our travels, it's all downhill from here.
Think of the St. Louis Arch - beautiful, isn't it? "
Did you just actually say this again? Are you being facetious?
"The trend is the key here not the YoY prices. If you don't think a trend is emerging now is a good time to buy so have at it. "
ReplyDeleteA "trend" is several consecutive events. What you have is "hope" or "conjecture" or "superstition."
"SC in DC said...
ReplyDelete.......I think that characterizing this chart as evidence of 'bubble bursting' is a bit premature:.....
David did not post that "this chart is evidence of bubble bursting"
He just posted data and then said “it will most probably mean large price declines in the weaker fall and winter months.”
Makes sense to me, your peak season is down, therefore your off season would be, well……..off.
David, I and others appreciate the data, no matter how benign it may seem. The realtors are sure not giving it out.
"Makes sense to me, your peak season is down, therefore your off season would be, well……..off."
ReplyDeleteThis is more conjecture. These posts are so incredibly worthless.
"David, I and others appreciate the data, no matter how benign it may seem."
ReplyDeleteThe problem is that you and Data take this benign data and extrapolate to predict catastrophe. You make unwarranted inferences, jump to conclusions, fill in holes in your data with your own biases, and ignore all data that contradicts your conclusions. Neither of you knows what that *&&% you're talking about, which makes your comments painful to read.
David's going to erase this in about 2 minutes, so remember it well.
"To those that know how to read these indicators, it is clear the direction the market is taking."
ReplyDeleteThis is where you always get it wrong. You're going on incomplete data, and piling speculation on top of conjecture.
The best evidence I can see of any bubble popping are the attacks spewing forth from the non-bubble believers at an increasingly alarming rate...they never seemed to be posting around here until recently. Obviously something's not going their way...
ReplyDelete"The best evidence I can see of any bubble popping are the attacks spewing forth from the non-bubble believers at an increasingly alarming rate...they never seemed to be posting around here until recently. Obviously something's not going their way... "
ReplyDeleteRight. Everybody who recognizes how stupid the "ball" analogy is is obviously a realtor or a flipper trembling in fear.
"David's going to erase this in about 2 minutes, so remember it well."
ReplyDeleteI will not. I would appreciate if you stopped posting under anonymous as it makes it more diffucult to debate. Thanks.
"The problem is that you and Data take this benign data and extrapolate to predict catastrophe. "
I had wrote in the post "it will most probably mean large price declines in the weaker fall and winter months. " this is NOT a catastrophe.
"I had wrote in the post "it will most probably mean large price declines in the weaker fall and winter months. " this is NOT a catastrophe. "
ReplyDeleteI guess you'd rather play word games than address the substance of the post -- that you leap to totally unwarranted conclusions based on scant and benign data. Fine. It's your site.
Play with excel.
ReplyDeleteAssumptions. 2005 home prices appreciated 20% from the beginning of the year to the end. This approximately means that prices increased 1.7% month over month. Jan-Dec values for a home valued at "100 units" in January would be:
1. 100
2. 101.7
3. 103.4
4. 105.2
5. 107.0
6. 108.8
7. 110.6
8. 112.5
9. 114.4
10. 116.4
11. 118.4
12. 120.4
If March '06 has an 8% YOY gain it would be 103.4 * 1.08 = 111.7.
As you can see, this is a real decline from prices in August.
The trend has emerged. The YOY price gains are hiding the month-over-month declines for the last 6 months.
Yes this is only an approximation because home sales are higher in spring than summer/fall, aren't linear yadda, yadda, but still, I find it compelling insofar that the market has changed and the momentum is swinging against rapid equity appreciation.
My $0.02.
"The trend has emerged. The YOY price gains are hiding the month-over-month declines for the last 6 months."
ReplyDeleteIf that were true, you would have just posted the month to month data rather than this garbage. Good try.
It's also patently false -
ReplyDelete"9. 114.4
10. 116.4
11. 118.4
12. 120.4
"
Those are the alst 4 months of 2005, all of which show month to month increases.
I don't have month to month data readily available. However, I can spot what the change in rate of appreciation implies.
ReplyDeleteSince mine is a generic example of how price appreciation year over year can hide price decline year over year. Do you see anything wrong with my illustration that I should modify?
Thank you,
My $0.02.
"Do you see anything wrong with my illustration that I should modify?"
ReplyDeleteyeah - the data you posted shows very clearly that there have not been declines in each of the last 6 months. There were increases in each of the last 2 months of 2005, and we also know that medians rose from March to April. Was there a decline in January, February, march? maybe (though you won't post the data), but since you like to dismiss good spring news as seasonal, I'm more than happy to dismiss your speculation that sales were down Jan to Feb to March as seasonal.
Anonymous 1:53 PM.
ReplyDeleteWhat are you trying to say? That I should pack the 20% 2005 gain all into the first 8 months of the year?
That would effectively show prices flat for the last 6-8 months rather than as declining. A fair observation. Here would be the adjusted results:
Roughly a 2.75% month over month increase through August.
1. 100
2. 102.75
3. 105.6
4. 108.5
5. 111.5
6. 114.5
7. 117.7
8. 120.9
9. 120.9
10. 120.9
11. 120.9
An 8% YOY gain for March would still be 105.6 * 1.08 = 114.0217 which is still less than prices after June...
My $0.02.
Now I don't understand at all - I thought you were showing actual data? Do you mean to say that you just made all of that up? This is historical fact. I'm not interested in your speculation about what "might" have happened.
ReplyDeleteAnd where is the 20% figure coming from? That part sounds made up. I'm willing to buy that the market was hotter in the beginning of 2005 than at the end, and that there was a lull like there is every winter, but you'd think the assertion that the market has given back a year's worth of gains could be substantiated. this is idle nonsense.
ReplyDeleteTo the anonymous posters that don't seem to understand my illustration, it's not based on actual sales numbers. A big negative I admit.
ReplyDeleteWhat I am trying to illustrate is a generic example of how YOY gains can mask Month-over-month declines.
I am making the following, admittedly huge, assumption that YOY gains can be assumed to be distributed evenly over the course of 12 months. My second post assumes that the gains were linear from Jan to Aug only.
My $0.02.
I understand it - it's an illustration of how some theoretical real estate market might have behaved. There's no reason to think it's THIS real estate market, so it's really not a very interesting post.
ReplyDeleteYou were defending yourself because somebody called you on your assertion that there was a "trend." Apparently you couldn't back up the assertion with facts. Your hypothesis isn't objectively irrational, but it also has no basis in reality.
Yes. My wording is strong that there is a trend down from August of last year based upon my generic illustration. I should have made it clearer this is my opinion.
ReplyDeleteThis is my opinion and it also happens to correlate with what most news reports are saying, that prices peaked in July, and is in line with Toll Brother's peak in stock price.
I don't purport to understand every nuance of the housing market but when industry reports, builders' stock prices, and approximation models all start lining up, I'm willing to entertain the idea that the market is turning.
My $0.02.
"I'm willing to entertain the idea that the market is turning."
ReplyDeleteNot only that, but you're willing to have an argument about it, without any supporting facts, on an internet message board.
The National Association of Realtors has released their 1st quarter median house prices today.
ReplyDeleteFor the U.S., first quarter 2006 prices are down 4.2% from third quarter 2005. (Roughly six months.)
For the Washington, D.C. metro area, first quarter 2006 prices are down 4.3% from third quarter 2005.
All these price drops are nominal. Inflation-adjusted price drops would be larger. Condos had similar results.
You can view the data here.
"All these price drops are nominal. Inflation-adjusted price drops would be larger. Condos had similar results.
ReplyDelete"
How are you reading that? It looks like prices for both Single-Family homes and COndos are up 11% in the DC area.
Hmm, my rough model would have only predicted a 2.4% decline rather than NAR's 4.2%.
ReplyDeleteAnonymous, perhaps you'll want to start promoting it?
My $0.02.
"
ReplyDeleteAll these price drops are nominal. Inflation-adjusted price drops would be larger. Condos had similar results.
You can view the data here. "
Why would you compare the winter of 2006 to the Summer of 2005? Is it because an apples to apples comparison shows a healthy rise in both house and condo prices?
Michael Youngblood of asset-backed securities research at Friedman Billings Ramsey & Co. in BizWeek interview:
ReplyDeleteWhat makes you more optimistic than other housing experts?
"I look at two economic indicators that I think drive the housing market: the growth in employment and the growth in personal income. Getting a job or a salary increase is what motivates people to buy their own home."
Do you think the housing bubble argument is overblown?
"Absolutely. It's overblown because there is no national housing market, so there can't be a national house-price bubble. However, there are bubbles in 75 of the 379 markets I studied. A bubble exists when the ratio of the median existing house price to per capita personal income exceeds 6.8 times. This definition is based on historical data of when other markets, like Houston and Boston, had bubbles."
Where are the bubbles?
"Most of the bubbles exist on the East and West coasts in such markets as New York City, Los Angeles, Washington, Phoenix, Honolulu, and Tacoma, Wash. Only 12 of the 75 cities are located inland: Boulder, Colo., Coeur d'Alene, Idaho, Flagstaff, Ariz., and Las Vegas among them."
bryce
"Hmm, my rough model would have only predicted a 2.4% decline rather than NAR's 4.2%.
ReplyDeleteAnonymous, perhaps you'll want to start promoting it?
"
Cherrypicked data is a wonderful thing. Look, if you want to hope for a market dropoff, be my guest. But don't pretend anything is happening yet, because it just makes the lot of you look ridiculous.
Anonymous 2:33,
ReplyDeleteThe 11.9% gain is year over year. Look at the quarter over quarter difference and do the math yourself. (In case you're not sure divide the Q3/05 number by the Q1/06 number and you'll get 95.8. That means a 4.2% decline.)
That's what I was trying to illustrate. And now, there are actual NAR numbers in lieu of my back of the napkin calculations.
My $0.02.
Oops. Invert my division...
ReplyDeleteMy $0.02.
When you hit a peak, first prices fall month-over-month, then they fall quarter-over-quarter, then they fall year-over-year. You can't fall year-over-year until you have already fallen quarter-over-quarter. You can't fall quarter-over-quarter until you fall month-over-month.
ReplyDeleteFor the record, year-over-year housing sales volume for the first quarter is down 2.1% for the entire U.S.
ReplyDeleteYear-over-year housing sales volume for the first quarter is down 18.2% for Washington, D.C.
Year-over-year housing sales volume for the first quarter is down 17.7% for Virginia.
Year-over-year housing sales volume for the first quarter is down 6.5% for Maryland.
The data is available here.
It's interesting how all the housing bulls shut up once the YoY sales volume numbers were posted.
ReplyDeleteIf you want a good example of what's to come for DC condos (yes, even in DC city limits) just look at what happens to any new condo building as soon as the units are delivered - the lockboxes suddenly start growing like mushrooms outside the building.
ReplyDeleteQuincy Court on 11th Street in NW is a good example - in less than a week the number of units on sale has gone from 19 to 27 - that's a THIRD of the building on sale, and nothing is moving.
Any of you a speculator on that development?
I'm new to this blog so could someone please help me understand, what do lock boxes have to do with selling condos? Also, what was the big deal with lock boxes on a bench?
ReplyDeleteAnonymous,
ReplyDeleteLock boxes are those little gray realtor boxes that hold keys to get into properties so prospective buyers can tour them. The reason this particular bench was so infamous is that it was saddled with dozens of lockboxes for a single new Condo development. Basically, a lot of people were trying (still are) to sell at once and the photo of the bench became a rallying cry for those that believe there is rampant speculation in today's condo market.
Hope this helps.
My $0.02.
A median priced house appreciated over 16k YoY? Outstanding.
ReplyDeleteAnonymous said...
ReplyDelete“…….The problem is that you and Data take this benign data and extrapolate to predict catastrophe. You make unwarranted inferences, jump to conclusions, fill in holes in your data…..
“Data” and I take this data, and compile and compare. No matter what the realtors spoon feed you, the numbers don’t lie.
Anonymous said...
ReplyDelete“……I guess you'd rather play word games than address the substance of the post………
Word games? Looks like you can’t follow a post. And you can't find the "other" button.
"Anonymous said...
ReplyDeleteNow I don't understand at all - I thought you were showing actual data?"
Some one get this anon a coloring book.
Anonymous said...
ReplyDelete“I understand it - it's an illustration of how some theoretical real estate market might have behaved. There's no reason to think it's THIS real estate market, so it's really not a very interesting post.”
No, you don’t understand it. It was not a theoretical real estate market. It was an example of how price appreciation year over year could hide price decline year over year.
No magic markers for you, stick to crayons.
Robert,
ReplyDeleteThank you for understanding.
And thank you for posting.
No longer beating my head against a wall,
My $0.02.
> Not only that, but you're willing to have an argument about it, without any supporting facts, on an internet message board.
ReplyDeleteAnd just what are you doing?
The shrillness of those denying problems in the real estate market speaks for itself.
I was a nervous buyer myself, so I understand the desire not to see the change from last year's euphoria, as an owner.
I backed out of the deal.
Before that, I just didn't visit sites like this--why get depressed if I was committed?
The fact that you're here indicates that you are also wondering about the condition of the market.
Anyway, now that I'm back in the market, I see that things have changed A LOT from last year. Prices are not falling as fast as I'd like--they never do--but they are falling. And I do not see how the momentum is going to reverse when we've just completed the "busy" season.
No stats, no proclamations, the observations of a buyer who is not going to make her decision based on medians, etc., but by what she sees when she's actually househunting.
Theorists, well, you continue your discussion, continue to ignore reality and yet obsessively follow blogs like this one.
I don't deny that I'm watching market trends--reading this blog speaks for itself.
Anon; I've never stated that median prices of homes will continue to rise. They will decline, but it is going to take some time for the trend to develop. (Next year at this time would be a better time to have this debate)
ReplyDeleteI do sincerely hope that you get to buy a home that you not only like and that feels like a good decision; but that you *love* and that you look forward to coming home to. Everyone deserves that.
Prices are going to fall fastest in the outer suburbs for reasons other than overheated appreciation (reasons like commuting concerns, fuel prices, maintainence costs, reliance upon motor vehicles to get access to a supermarket, etc.) So if prices in the 'burbs start looking attractive... and the 'burbs don't work for you otherwise; then don't buy there.
bryce
(disclaimer; I'm not intentionally making any assumptions about you, anon, but it is impossible to reply to your post without make at least some small presumptions. :-)
I saw CO on the list of potential bubble markets above.
ReplyDeleteEven our local media is beginning to sound the alarm...such as in this recent news article
http://www.rockymountainnews.com/drmn/real_estate/article/0,1299,DRMN_414_4695955,00.html
"Those ARMs starting to hurt:
As payments go up, so do foreclosures"
Here's are 2 brief excerpts:
"The Denver area may be hit particularly hard because homeowners in Colorado on average have little equity in their homes.
In Colorado, 28.5 percent of homeowners have 5 percent or less equity in their homes, and 47 percent have 15 percent or less equity, according to a report released earlier this year by Christopher L. Cagan, director of research and analytics at First American Real Estate Solutions in Santa Ana, Calif.
Only Tennessee homeowners, on average, have less equity in their homes, the report said."
"Brian Bartlett, of RE/MAX Southeast, agrees.
"It is absolutely mortgage roulette," Bartlett said. "Either buyers were not informed by the mortgage broker or all they chose to hear was the answer to the following question: What is my initial monthly payment? When you combine ARMs, 100 percent financing, negative amortization, seller-paid closing costs, rising rates, falling prices, rising inventory and a continuing sluggish Denver economy, you have a recipe for 1987 to 1990 revisited."
That's when the local housing market crashed. "
-----
my opinion...I don't see how markets like these can avoid repeating history.
I have a question.
ReplyDeleteIf you are a home owner and you are underwater on your mortgage, would you keep paying your mortgage?
I'm curious because my feeling is that for a majority of homeowners, they will keep shelling out the cash for the mortgage. I wish I owned a polling firm.
underwater --> house is worth less than loan.
PTT,
ReplyDeleteYou're obligated to pay that loan. Sure you could walk away and let the bank foreclose but that will cost you dearly and leave you with a destroyed credit rating. You simply continue to pay. In 5-10 years inflation and wage growth should eventually put you back above water. The real danger, and the risk inherent with owning property, is if you are forced to sell before you get back above water.
My $0.02.
So you would continue to pay a mortgage where your loan was say $80K more than what your house was worth?
ReplyDeleteI'm asking because everyone I talk to says yes they would keep paying and I find that surprising.
My view on finances tend to be out of the norm but on this subject I just don't understand the reasoning. Eating a 80K loss just to salvage a credit rating seems pretty stupid to me. At the very least, I figure people would call the bank and start negotiating on partial debt forgiveness.
I'm not talking a few thousand underwater here. Over 5 year period that easily gets covered by your principal payments.
I didn't know a lender can get a deficiency judgment. The loan is secured by the property so why would the bank be able to collect more? That doesn't make sense to me. Could you reference me to a law link? Thanks in advance.
20% of a 400K house is 80K. So I figure thats what a lot of marginal homeowners will be facing if history repeats. I'm trying to figure out how soon do people throw in the towel when the prices start sliding. What I would do is definitely not what most people would do.
PTT,
ReplyDeleteWhat are you saying you'd do? Walk away and let the bank foreclose? I believe a lot of people have done this historically in boom/bust towns. It's not unprecedented.
Keep in mind though, people may have assets outside of their primary residence that would have to be used to pay off the difference ($80K in your example).
Granted I don't know all of the laws on foreclosure, and liens, and debt recovery etc, but I know you sign a ton of papers (sign your life away as some people joke) to keep you as closely bound as possible to repaying that loan.
My $0.02.
David,
ReplyDeleteI don't think 1 year is good example of of trends in median price growth. Historically, it may be true that March - April is a strong time for median price growth, but how volatile is that number? Plus, I think month to month changes in median price are too influenced by the product offered for sale to be a reliable indicator in trends.
All that being said, while I don't believe the numbers represents a "real bummer", they could be the beginning of one. We will all see.
I do appreciate your efforts to get information out whether or not I agree with your analysis.
For me, housing is just one expense. I like my house, I self maintain the property, I devote effort in gardening/landscaping as a hobby. But I would drop the house in a heartbeat if I were underwater by $80K. Like I said, I don't think I look at things the same way as most people.
ReplyDeleteThe house is an investment that the bank and I are partners in owning. If it appreciates, I garner the gains. If it is a money pit, the bank and I share the loss. What reason should I take up the bank's share of the loss?
I pay the interest to the bank for this privilege and the bank accepts that interest as their payment for assuming the risk. A secured credit risk. I could be wrong, but I can't see anything in the loan forms where my income is collateral for the loan.
PTT,
ReplyDeleteI guess we would need someone more knowledgeable on the fine print in mortgage loans to explain an individual's liability. I just don't imagine it's that easy to divest yourself of the debt without getting mired in a lot of red tape...
My $0.02.
PTT,
ReplyDeleteAllowing the bank to repo a property seems a little myopic in terms of long-term real estate price trends. Let's say you owe $325K for a house which is currently worth $320K. If you just walk away, you get nothing in return but a lousy credit rating. A better strategy would be to sell at a slight loss (avoid using traditional RE agent) and keep your good credit rating should you ever be in the market for another property, a car, etc. In addition, if you’re monthly payment is not significantly greater than local rents (taking into consideration the tax break of carrying a mortgage) and there’s still a reason to live where you are, then it probably makes more sense to simply wait out a downturn in the real estate market. I guess the real question is, what price would you put on your good credit rating? $5K? $10K? $100K? Credit ratings impact interest rate on loans, credit cards, etc. If you intend on carrying any loans before you can improve your credit rating, you should estimate how much the increased interest rate will cost you in today’s dollars.
Katalase
Well that is the question. I'm interested to know peoples pain point. From the answers I hear, people will keep paying no matter the level of pain.
ReplyDeleteI read somewhere that people will tend to survive with massive debt for 1-2 years before filing for bankruptcy. At that point they are so deep in the red there is no chance of getting out.
I can accept a 20% loss since its already sunk cost for me. At 30%, I'll use the equity line to reduce my exposure to 10% and then let the banks eat the rest of the loss. Of course this all depends on the fine print.
>The house is an investment that the bank and I are partners in owning. If >it appreciates, I garner the gains. If it is a money pit, the bank and I >share the loss. What reason should I take up the bank's share of the >loss?
ReplyDeleteWell, thats not exactly correct. The *debt* is an investment for the bank. The bank does not consider the house an an investment, while you may. The bank considers the house as a security for the debt.
That's what the bond market is all about - debts as investment.
>I pay the interest to the bank for this privilege and the bank accepts >that interest as their payment for assuming the risk. A secured credit >risk.
While credit risk may be priced into the interest, interest is not just that. It involves credit risk, inflation risk, and a real cost of money(real interest rates).
>I can accept a 20% loss since its already sunk cost for me. At 30%, I'll >use the equity line to reduce my exposure to 10% and then let the banks >eat the rest of the loss. Of course this all depends on the fine print.
Mortgage debt can be recourse or non-recourse. Some states have only purchase debts as non-recourse, refinance debt is recourse. Other states have all mortgages as recourse. Home equity is also like that.
Almost all non-recourse loans have fraud exceptions. If you commit fraud, they can get a deficiency judgement and make a claim on other assets.
Of course, if you only put 20% down, and value goes down 30%, your equity is -10%, a good bank may cancel your equity line. Even if the bank did not notice, it could be considered fraud if they find out later you did this on purpose. All depends on whatever agreement you signed.
Std. disclaimer: I am not a lawyer or financial adviser. For proper advice, consult a lawyer of financial adviser.