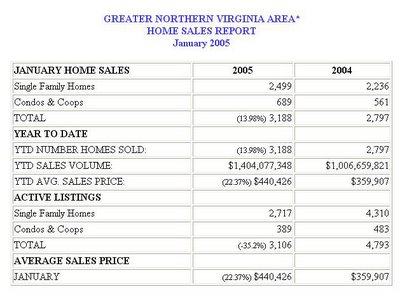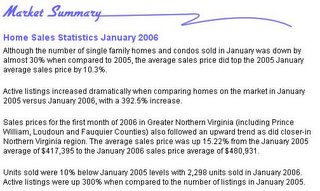
In the original January 2005 market statistics the average sales price for all housing units in the Greater Northern Virginia areas was 440,426. Sales were 3,106 units. However, in the January 2006 market summary report its says that the January 2005 sales price was 417,495. 417,495 is not equal to 440,426. The report then uses those number to say the average sales price increased 15.22% YoY ( from 417,495 to 480,931) when based on the original January 2005 number there would be a 9.1% increase.
Also in the January 2006 market summary its says that 2,298 housing units were sold in the Greater Northern Virginia area in January 2006. It continues and states that represents a 10% decrease from January 2005 numbers. So that would mean January 2005 numbers would be about 2,550. However, in the January 2005 report there were 3,106 units. If they used the original numbers of 3,106 it would mean there was a much more ominous 27% decrease in units sold compared to January of last year.
What is the truth? Are the Realtors intentionally giving out wrong statistical information or are they just making innocent mistakes?
For now, I will give the Realtors the benefit of the doubt.
Update 2/16/ 4:55: [Some of the numbers have already been fixed.]


The realtors have been contacted about this discrepency.
ReplyDeleteGreat analysis.
ReplyDeletewww.dcbubble.blogspot.com
Is it possible that houses were signed to be bought, were counted towards the sales in January, but then were called off or never went through in February/March?
ReplyDeleteWould that account for the difference in statistics?
Jill Landsman the Manager, Communications & Media Relations for the NVAR contacted me and wrote "I am aware of this discrepancy and I am working with the MRIS database folks to try and understand why there is a discrepancy. I should know more today."
ReplyDeleteThanks, Shill -- er, Jill.
ReplyDeleteI didn't have any trouble parsing the data. The discrepency could merely be one of cachement. One refers to "the Greater Northern Virginia area" and the other "Greater Northern Virginia (also including Prince William, Loudoun and Fauquier Counties)." It also isn't clear that both are equivalent definitions of all homes or just SFRs or a mix. I'll wait for a clearer explaination.
ReplyDeleterobert cote,
ReplyDeleteThere are only twe geographies that consist of multiple counties that are reffered to by the NVAR: 'Northern Virginia Area' and 'Greater Northern Virginia Area.'
If you look at either one of the original reports from January 2005 there is zero mention of the 417,495 figure.
You write "It also isn't clear that both are equivalent definitions of all homes or just SFRs or a mix."
Then the NVAR CANNOT make a oomparison between last years number and this years number.
I just got a message from the NVAR that the information has been corrected. I checked and it is still inconsistent.
ReplyDeleteIt's not so easy to correct. As a statistician myself, I think they need a better data analyst to help them changing a lot of previous spreadsheets if the data has to be consistent. I've saved the spreadsheets from Jan05 to Dec05 in case they really dare to do so. And David, you may want to save previous spreadsheets also just in case.
ReplyDeleteMy guess: they don't want the data to say that there is only single digit YOY percentage increase and more than 20% units YOY decrease in Great Northern Virginia. Or in other words, they want to create a "soft landing" image.
I have been in ongoing communication with someone over at NVAR who has been very responsive. They have fixed the sales numbers to reflect the true decline of 27.9% from January 2005 to January 2006 in Greater Northern Virginia. [It used to say thas sales fell only 10%]
ReplyDeleteThe average sales price information still needs to be fixed.
"Units sold were 27.9% below January 2005 levels with 3,188 units sold in January 2006."
ReplyDeleteThe NVAR needs to fix this.
This sentance is incorrectly worded. It could read "Units sold in January 2006 were 27.9% below Janurary 2005 level . In January 2006, 2,298 units were sold which is significantly lower then the 3,188 units sold in January 2005.
http://www.drodio.com/secondary.cfm?content=virginia-and-washington-dc-average-house-price
ReplyDeleteSee the home value clock here!!
And they claim people not buying home now losing $13.25 on an average in equity.
This website should be banned :(
They need a REVERSE clock now. That is d*mn ridiculous.
ReplyDelete