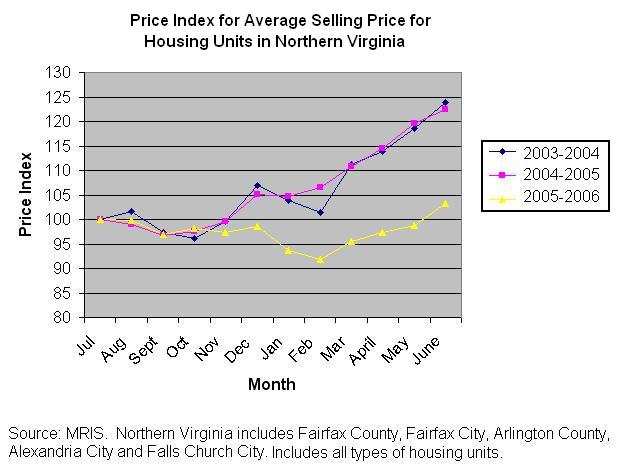
The above graph shows the a price index for the average selling price for all housing units sold in Northern Virginia. The graph is meant to show how the last 12 months has been very different from the 2 prior years. The housing boom is clearly over in Northern Virginia.
The divergence between the three series begins in the month of December. [I will also make a graph using the median price]. The data comes from the MRIS (Metropolitan Regional Information Systems, Inc. - MLS Resale Data).


Interesting that from March through June 2006, the rate of increase (i.e. slope of the line) is almost (but not quite) as great as it was in 2005 and 2004. It is only because of the net decline from July 2005 to Febuary 2006 that there is such a big difference between the two years.
ReplyDeleteSo are you saying that it is a bad time to buy?
ReplyDeleteThe WashingtonPost.com (online edition) front page is broken in to two sections. On the top half of the page is the national news, and on the bottom half of the front webpage is the local news.
ReplyDeleteDid anyone else notice that now the "Real Estate" section has been removed from the bottom part of the front page? It used to be a section header, with real estate news. Now it's gone.
I guess nothing to talk good anymore about real estate (if you're a current homeowner and trying to sell).
Don't confuse this with the section bar, which runs along the top, on which Real Estate is still a link.
g.f mcnegamsky,
ReplyDeleteYes it is a bad time to buy in DC.
sc in dc,
I will post the median number next week, which will be useful to compare against average.
So what this graph is saying is houses in NOVA are slightly more expensive in July 2006 than July 2005?
ReplyDeleteDC Condo Watcher said...
ReplyDelete"I guess nothing to talk good anymore about real estate (if you're a current homeowner and trying to sell)."
Keith brought up "tone" in the another thread below. You have supplied a good example of such "tone". What does your statement bring to the discussion other than sarcasm?
Interesting. These charts indicate that prices tend to dip from Aug to Nov, blip up, then dip again mid Dec to March.
ReplyDeleteAt this point, the spring selling season kicks in and there is decent growth through July at which point the pattern repeats.
I would expect then that prices, whatever they come in at for July, would be the peak through November.
My $0.02.
" So what this graph is saying is houses in NOVA are slightly more expensive in July 2006 than July 2005?"
ReplyDeleteThe average selling price is slightly higher. Which does not neccasarily translate to individual houses. The median selling price is stagnate at 0% YoY in NoVa.
maybe GOP will grow balls and cut some gov parasite workers
ReplyDeleteYes, it is a tough time to buy. TheStreet.com today: “Raymond James released a report that said contracts for housing sales fell 42% year-over-year in June in the greater Washington area, according to an area realtors groups. Closings declined 38% and the inventory on the market now represents 7.1 months of supply, compared with 1.6 months in June 2005, and 5.9 months in May.”
ReplyDelete“‘We continue to believe the Washington, D.C., market is headed lower as excessive speculation and overbuilding will weigh on the market for the foreseeable future,’ Raymond James analyst Rick Murray wrote.”
I believe the median price is already slightly negative in NoVA for areas outside Beltway. Prices are falling at outer suburbs further from DC, while rising in Arl and toward DC generally. Someone could repost the table here, which I had seen a couple days ago.
ReplyDeleteInventories ran way up in the DC area, for the 1st half of the year, and now they are just kinda steady. Every now and then I will look at single family houses in vienna on homesdatabase, and the same deadbeat houses are always there.
ReplyDeletegfm said:
ReplyDelete"Every now and then I will look at single family houses in vienna on homesdatabase, and the same deadbeat houses are always there."
and they will continue to be. Even when I was looking during the crazed days of bidding wars, there were always those same overpriced houses week after week on the listing site. you'd think they'd learn their lesson and lower their price. i had one house where i offered full price and the seller (who happened to be a real estate agent) wouldn't take it. he said he was looking for "more than asking". my agent said he would probably take my offer to other interested parties as a way of getting a higher sales price. in any case, he was right at the high end of what i could go, so luckily i didnt go out on a limb and overstretch myself ... cause a house in the end i paid the same price for my house in a much more desirable neighborhood ... with seller financing at only 5% fixed. He insteady finally sold it for $10K more than the full asking price about 6 months later ...Which supposedly was what was best for him because his new house wasn't ready till then. I guess it's true what they say about things working themselves out in the end if you just learn to not get bitter and keep on trucking. I ended up with a better house and he ended up with his price (+$10K) AND the moving timeframe he needed/wanted.
"there were always those same overpriced houses week after week on the listing site. you'd think they'd learn their lesson and lower their price"
ReplyDeleteYeah, I remember those cracker boxes, except this time, it is the same and only 75 houses (or townhouses) between $300-600k, month after month after month. Here is some advice...a $10k price reduction is not going to sway a buyer eyeing these houses from the sidelines. Chances are people on the sidelines are like vultures cirling, smelling blood, and waiting for that last breath. They are lean and hungry - Can you feel them?
Rents could fall as new condos become apartments:
ReplyDeleteOoops...this ain't good for flipper
http://biz.yahoo.com/usat/060713/13639800.html
They call him Flipper, Flipper, faster than lightning,
No-one you see, is smarter than he,
And we know Flipper, lives in a world full of wonder,
Flying there-under, under the sea!
Everyone loves the king of the sea,
Ever so kind and gentle is he,
Tricks he will do when children appear,
And how they laugh when he's near!
They call him Flipper, Flipper, faster than lightning,
No-one you see, is smarter than he,
And we know Flipper, lives in a world full of wonder,
Flying there-under, under the sea!
Why is it so hard to find foreclosed properties? It seems like you have to pay money just to get to see the foreclosure listings. Anyone know how to find foreclosed properties without spending too much money?
ReplyDeletegfm said:
ReplyDelete"They are lean and hungry - Can you feel them?"
yes, they are. and the sellers and builders are fat and satiated from years of escalating prices and equity building. I wonder which one can wait out which longer? especially considering that the fundamental are still there. (There's a good story on that in today's Post).
and before you say "oh, but what about the people who bought in the last couple years?" most of these people were rolling over large equity dollars from previous house purchases.
www.washingtonpost.com/wp-dyn/content/article/2006/07/14/AR2006071400080.html
ReplyDeleteIf you go to HousingTracker (which David links to), the most recent data it has for asking prices in the DC area are DOWN from last week. Inventories are also UP from last week.
ReplyDeleteA Redskins fan
I got a nice little parcel in the Gaza Strip that I will sell you for cheap!
ReplyDeletedc_too,
ReplyDeleteThe "real" foreclosures don't make it onto these lists. They are sold at the courthouse steps. Only the ones that have too high a loan balance go back to HUD, VA, etc.
May still find a bargain or two, but all the "pro's" have passed on them. fwiw.
"and before you say "oh, but what about the people who bought in the last couple years?" most of these people were rolling over large equity dollars from previous house purchases."
ReplyDeleteOver half of the buyers in the DC area during 2005 used interest-only financing, so I don't think so.
Psst, statements like partly explain why people on this blog sometimes take shots at you.
keith,
ReplyDelete"ver half of the buyers in the DC area during 2005 used interest-only financing, so I don't think so."
uh ... bad assumption ... I used interest only financing and rolled hundreds of thousands of equity from the condo into the house ... interest only financing is a very smart financial move for people with income to shield ... my entire mortgage payment is tax deductible and instead of putting more cash into the house, I am able to invest the $1,000 or so per month I am saving in equities that I get at a discount from my employer ...
keith, bubbleheads act as if everyone has the same financial circumstances ... please try to remember that just like it is best for some people to rent, it is best for some to use interest only loans, ARMs or whatever .. .there are no blanket soltutions for everyone ...
dc_too,
ReplyDeleteHave you ever examined real estate assessment info on a house that was foreclosed? Have you reviewed an appraisal that includes a "forced-sale" comp?
These comps are disregarded. Not to say that prices may fall in general, but a foreclosure or other forced-sale is not going to kill the comps.
My personal residence is listed as a duress/foreclosure in the sale history.
The real issue w/IO is how many people with little to no equity (in other words, first time homebuyers) are using them to stretch into something they can't afford?
ReplyDeleteLance brings up a good point that an IO is a good solution for certain people (as he described).
Anyone reading this blog in the mortgage industry might have a better idea of who is using IO's and for what reason.
Lance's gamble worked because he sold the condo before his I/O loan reset and because of the record appreciation real esate was seeing at that time.
ReplyDeleteNot everyone will be so lucky. Being 100% leveraged is risky.
Lance said,
ReplyDeleteI guess it's true what they say about things working themselves out in the end if you just learn to not get bitter and keep on trucking.
I admit I am a bit of cynic but wow. If this is the prevailing Pollyanna attitude I can see why housingheads aren't worried.
anon 3:10,
ReplyDeleteYour last sentence betrays the myopic thinking of most bubbleheads. Exactly how many homeowners are 100% leveraged AND have no other reserves?
whitetower,
ReplyDeletefirst off, I said 100% leveraged - not neg. am.
Secondly, I know some very wealthy people who are 100% financed and interest only.
The point is that the bubblehead theory of doom and gloom can't work unless you believe their assumptions about the precarious situation of homeowners.
Yes, shifts take place at the margin, I agree.
ReplyDeleteHere is the reality of the situation...Most bubbleheads really want to buy a house, and they struggle with the idea of spending a fortune on a house and then being trapped in that house because the value has gone down. No one wants to make a bad buy regardless of the amount of loss.
The housing bulls are scared shitless because they took the plunge and now face the prospect of losing their a$$ or a lot of money becauser they did not listen to their gut before buying. They want to be positive, but at what expense?
Who will the winners and loser be? It is too early to declare victory on either side, but it sure is fun to watch!
Yes, I have just stated the obvious, and if you disagree, then you are most likely overcommited to one side or the other.
a fool and his money are soon parted
ReplyDeleteThe homebuilders continue to take their lumps. Toll, KB, and Pulte have lowered guidance. Most recently, it was DH Horton. Regarding the DC market, this item appeared in an article at www.thestreet.com:
ReplyDelete[In other builder news Friday, Raymond James released a report that said contracts for housing sales fell 42% year over year in June in the greater Washington area, according to an area realtors groups. Closings declined 38% and the inventory on the market now represents 7.1 months of supply, compared with 1.6 months in June 2005 and 5.9 months in May.
"We continue to believe the Washington, D.C., market is headed lower as excessive speculation and overbuilding will weigh on the market for the foreseeable future," Raymond James analyst Rick Murray wrote.]
http://www.thestreet.com/_yahoo/newsanalysis/homebuildersconstruction/10296849_2.html
It's the inventory, folks.
Anonymous said...
ReplyDelete"Lance's gamble worked because he sold the condo before his I/O loan reset and because of the record appreciation real esate was seeing at that time.
Not everyone will be so lucky. Being 100% leveraged is risky."
there was no gamble ... (a) the I/O loan is on the house I bought after selling the condo (b) I am not 100% leveraged ... I was responding to someone who thought interest only loans are for people who want to be 100% leveraged. I was explaining that I rolled over lots of equity from the condo. Incidentally, in many situations I could see 100% leverage being appropriate .. 1st time buyers who have little or no savings ... bubbleheads who don't want to cash in their stocks when we are at a low in the equity markets such as now ... a flipper who is only planning to hold on to the property less than a year ... Each person has to look at his own situation and see what is appropriate for them.
Yes, it's going to collapse. Any time now. Very soon. Right away. Any time ...
ReplyDeletewhitewater said:
ReplyDelete" A house owner would be 100% leveraged only if he had no other reserves. That's the point."
I think the meaning was that the property in question was 100% leveraged ... not the person. (I.e., someone with $1M in stock and CDs could decided he want to buy that $300,000 condo with 100% rather than cash out any of his stock or CDs ...)
WhiteTower said...
ReplyDelete"my entire mortgage payment is tax deductible and instead of putting more cash into the house, I am able to invest the $1,000 or so per month I am saving in equities that I get at a discount from my employer ...
Hey, that was pretty smooth lance... except that when your IO resets you'll have to refinance and have to pay several thousand dollars in refinancing fees, thereby negating your investment strategy."
No, not true. Why would I want to refinance a 5% interest rate when chances are that I won't get a lower rate when it resets at the 10 year mark to a 20-yr amortization schedule. The assumption was that between year zero and year 10 I would be earning enough more to pay the 44% increase in payment. (Either through raises at work or through increased rents on the rental in the property.) I recently started a new job, and I my earnings have already increased to where the increase at year 10 is covered ... 9 years ahead of schedule.
Why such negativity .. or belief that you won't be able to handle changes?
This comment has been removed by a blog administrator.
ReplyDeletewhitewater said:
ReplyDelete"Hey, that was pretty smooth lance..."
someone asked earlier why the "tone" ... I'm going to start pointing out this "tone" when I see it ... I think it'll be pretty obvious where the tone is orginating (i.e., bubbleheads or housing heads) ...
According to the WaPo article, most builders think the "fundamentals" are still there and condo market is still strong. What do y'all think will happen to the DC/NoVa real estate market if a recession occurs? I would assume the demands will be greatly reduced and putting more pressures on the housing price. Well I guess people don't think about that happening.
ReplyDeletehttp://www.forsakencraft.com/dotdavid.wmv
ReplyDeleteanon asked:
ReplyDelete"What do y'all think will happen to the DC/NoVa real estate market if a recession occurs?"
but that is what they mean about the fundamentals still being there ... i.e., the region's economy is still growing, there's low unemployment, etc. of course, things can change ... but there aren't any signs of it changing out there yet ... actually, quite the contrary, we have all the signs or an expanding economy as the article states. this is supported by every other article/study coming out lately about the local economy ... a few of which I have linked to in past posts. quite simply, the economic recession that would be required to make prices decline substantially, just isn't in the cards yet for the local economy.
This comment has been removed by a blog administrator.
ReplyDeletewhitetower said:
ReplyDelete"I thought that for the housingheads it was the other way around -- that purchasing a home was an "investment." I've never heard of an "investment" of this sort."
I've said it multiple times. A house is not an investment. That is realtor talk. A house is your roof over your head ... an expense which needs to be minimized over time. I've emphasized this last part because that is one of the disconnects between housing heads and bubble heads. Over time, I will be paying far less to live in my bought house than you will be paying to live in your rented apartment. Even at the high prices that houses have been selling for lately. Do the math, you'll see. This is due partly to the fact that interest rate are so historically low. Be sure to take into account the fact that a mortgage gets repaid with nominal dollars but rents get paid with real dollars.
As a housing head, I think it is irresponsible for people to be talking about making investments of any kind ... stock market, housing market, etc. ... before they have ensured their long term housing needs. Once that is done, then they can use the surplus to "play the market". In my opinion, to do otherwise is to gamble with the roof over your head and find yourself on the street. When you rent you are gambling with this. Rents are subject to the whims of the landlord as well as the march of time and the resulting inflation that comes with them. Where inflation helps mortgage payers by making their nominal dollar payments less and less over time, it hurts renters by making their real dollar payments more and more over time. And that is but one factor one is playing with when one plans to rent rather than buy over the longterm --- which I know really doesn't even apply to most bubbleheads who are just waiting for the prices to fall drastically before buying.
Hey Lance,
ReplyDeleteThe true bubbleheads will never acknowledge a logical argument. It seems statements get twisted and THEN argued.
Lance and Investor:
ReplyDeleteThe three fundamentals of real estate are:
Prince/income ratios: Generally the rule of thumb is approx. housing price should be no more than 7 times median personal income.
Inventories: Above 6 months is dangerous. According to the latest article, it's 7 months.
Price/rent ratios: The price-to-rent multiple is generally 15, and shouldn't be much over 20. In DC, it's 26.
All of the fundamentals point to bad signs for the DC housing market.
So how can you avoid "bubbleheads" of ignoring fundamentals?
Finally, every financial advisor worth a lick will tell you to buy a house AFTER you've taken care of other saving and investments.
Investor, would you actually tell someone to buy a house before they've saved money and started their retirement saving?
Frankly, Lance is demonstrating financial illiteracy with that advice.
Investor, you'd buy yourself a lot more credibility if you didn't side with Lance, especially during his crazier moments.
Finally, Investor and Lance, what do you think will happen to DC housing prices between now and 2009? Be as specific as you like.
You can differentiate between condos, townhomes, and houses. You can differentiate between classic neighborhoods like Dupont and Georgetown, up-and-comers like U-Street and Gallery Place, areas like Howard and Union Station, inner suburbs, outer suburbs. But I would actually like to hear what you actually believe, rather than uninformed cheap shots.
"As a housing head, I think it is irresponsible for people to be talking about making investments of any kind ... stock market, housing market, etc. ... before they have ensured their long term housing needs."
ReplyDeleteInvestor, you do realize that this is the completely wrong approach, right?
People are supposed to have savings and investments BEFORE they buy their house. You know that very basic pieve of financial management, right?
Investor, you must disagree with lance on this point if you are to have any credibility with me.
va_investor said:
ReplyDelete"It seems statements get twisted and THEN argued."
Oh so true! It's like they want to win their argument at all costs ... which ironically, in this case is their own personal financial well being.
The bottom line is that you and I are speaking from experience in the real estate market (which they profess to wanting to enter "when prices go down 50%") and we have nothing to gain from these posts other than the personal satisfaction that we have helped someone by sharing our success stories. We have no real stake in whether there is a bubble or not. Irrespective of what happens out there with prices, you will continue renting your properties using the rents collected to pay your mortgages, and I will continue living in my house knowing that my "locked-in" mortgage payment is a managable one now and well into the future. And what I find truly ironic is the skeptism and "tone" with which our sharing of our success stories get met. It's as if there is some vast conspiracy out there attempting to take their money and we are part of it. That is paranoia that will hold them back from success not only in respect to houseownership but in every other aspect of life. IMHO, conspiracy theories are coping mechanisms allowing someone to reduce the not-understandable to something that is understandable and able to be grasped. The problem of course is that you end up dealing with the wrong problem, and applying a simple solution for a complex problem. In this case, a bursting bubble that will bring down prices by 50% is that simple solution for a oh-so-complex problem as rising house and condo prices. You and I have tried to illustrate by way of example that there really are tools out there for dealing with the real and complex problem, but the bubbleheads by and large aren't even acknowledging that the problem is far greater and far more complex than a conspiracy driven by real estate agents and the whole housing industry working in concert as they believe. Though, I am beginnig to suspect that David is starting to come to this realization. It's not as much from what he has been saying of late but rather from (a) what he has not been saying ... It would be interesting to hear his thoughts on the "conspiracy" theory held so dear by so many bubbleheads.
And you don't need a recession for housing prices to decline, if they're already too high in the first place.
ReplyDeleteAfter all, inventories are already stretching out.
In other words, Lance can't respond to the specific points I brought up.
ReplyDeleteI'll repreat my post for Lance and Investor, in case the missed it:
ReplyDeleteLance and Investor:
The three fundamentals of real estate are:
Prince/income ratios: Generally the rule of thumb is approx. housing price should be no more than 7 times median personal income.
Inventories: Above 6 months is dangerous. According to the latest article, it's 7 months.
Price/rent ratios: The price-to-rent multiple is generally 15, and shouldn't be much over 20. In DC, it's 26.
All of the fundamentals point to bad signs for the DC housing market.
So how can you avoid "bubbleheads" of ignoring fundamentals?
Finally, every financial advisor worth a lick will tell you to buy a house AFTER you've taken care of other saving and investments.
Investor, would you actually tell someone to buy a house before they've saved money and started their retirement saving?
Frankly, Lance is demonstrating financial illiteracy with that advice.
Investor, you'd buy yourself a lot more credibility if you didn't side with Lance, especially during his crazier moments.
Finally, Investor and Lance, what do you think will happen to DC housing prices between now and 2009? Be as specific as you like.
You can differentiate between condos, townhomes, and houses. You can differentiate between classic neighborhoods like Dupont and Georgetown, up-and-comers like U-Street and Gallery Place, areas like Howard and Union Station, inner suburbs, outer suburbs. But I would actually like to hear what you actually believe, rather than uninformed cheap shots.
keith said:
ReplyDelete"People are supposed to have savings and investments BEFORE they buy their house. You know that very basic pieve of financial management, right?"
keith, I didn't say that one must buy a house before dealing with savings and investments. I said one must ensure their housing needs before dealing with savings and investments. There is a difference there, a difference meaning that yes, it can be appropriate to be renting at different periods in ones life. It just isn't appropriate for most people in most circumstances over the long haul as it is just too costly and too uncertain in nature. Again, I am trying to make the point that owning where you live is not a financial investment, it is an expense ... And as such the goal isn't to returns on investment, but rather expense minimization over the long run.
keith said:
ReplyDelete"Keith said...
In other words, Lance can't respond to the specific points I brought up."
again, "tone" ... do you really think I wrote all that up in the 2 minutes between when you posted it and I "responded" ... again, a wrong assumption ... did it ever cross your mind that I had maybe been writing that AT THE SAME TIME you were writing YOUR response to Va-Investor?
And as for my answering each and everyone of your questions ... sorry, I am tired of that game ... you are looking to dissect arguments so that you can turn them around, shift the argument, and then declare victory on an argument based on you assumptions that get presented as facts ... sorry, play that game with someone else.
Lance, then because housing prices are unsustainably high right now, I reduce my expenses over the long run by renting now and buying when real housing prices are lower in a few years.
ReplyDeleteHeck, even if prices stay flat, as you have claimed they will, I save money in the meantime by renting, and it will be at least 3 years before buying makes sense, even assuming 7% rent growth. My rent's only grown at 3%, however...
From the point of long-run housing cost minimization, I'd be a sucker to buy right now.
Keith said...
ReplyDelete"And you don't need a recession for housing prices to decline, if they're already too high in the first place."
Why? Because housing prices are out of your reach? Apparently they haven't been out of reach of all the people out there who have been buying them. And --- short of a recession --- these people will continue to be able to afford these houses at these prices ... or more. The falasy of your argument is that you are extrapolating your financial circumstances to everyone else. Most of us are doing just fine around here, thank you.
"And as for my answering each and everyone of your questions ... sorry, I am tired of that game ... you are looking to dissect arguments so that you can turn them around, shift the argument, and then declare victory on an argument based on you assumptions that get presented as facts ... sorry, play that game with someone else."
ReplyDeleteLance, I asked very specfic question about three major fundamentals in the DC housing market, which all happen to be bad. In addition, I asked you for your actual beliefs about what will happen.
Lance, how many months of inventories do you believe there have to be to make prices fall?
But yes, Lance, I am looking to see what you actually believe and how you deal with real facts. Not very well, it look like. But you can prove me wrong by dealing with my specific questions.
Keith,
ReplyDeleteAt the risk of losing credibility with you, I state the following:
Homeownership is a key to retirement planning. One should be able to buy a home, save money, and max out the 401 and IRA simultaneously.
If you can't do this then maybe you are setting your sights too high. A "starter" home seems to be a lost concept.
The only thing we postponed was starting a family. I wanted to be "set" financially before taking that step.
Prior to kids, we bought fixer-uppers and moved every year or two, often keeping the existing house as a rental.
This plan can still work today, but the "cost" (time, effort, risk) seems to high for most bubbleheads. They want guarantees.
Keith said...
ReplyDelete"Lance, then because housing prices are unsustainably high right now, I reduce my expenses over the long run by renting now and buying when real housing prices are lower in a few years."
finally you and I are on the same page! YES, if you truly believe that housing prices are going to go down in a few years and interest rates won't go up enough to negate those lower prices, then you may be on to something. at least you are acknowledging that longterm you want to be buying and not renting ... that is a good move.
"Why? Because housing prices are out of your reach?"
ReplyDeleteBack to the "you disagree with me so you must be poor."
How about dealing with this?:
he three fundamentals of real estate are:
Prince/income ratios: Generally the rule of thumb is approx. housing price should be no more than 7 times median personal income.
Inventories: Above 6 months is dangerous. According to the latest article, it's 7 months.
Price/rent ratios: The price-to-rent multiple is generally 15, and shouldn't be much over 20. In DC, it's 26.
All of the fundamentals point to bad signs for the DC housing market.
So how can you avoid "bubbleheads" of ignoring fundamentals?
Finally, Investor and Lance, what do you think will happen to DC housing prices between now and 2009? Be as specific as you like.
You can differentiate between condos, townhomes, and houses. You can differentiate between classic neighborhoods like Dupont and Georgetown, up-and-comers like U-Street and Gallery Place, areas like Howard and Union Station, inner suburbs, outer suburbs. But I would actually like to hear what you actually believe, rather than uninformed cheap shots.
"YES, if you truly believe that housing prices are going to go down in a few years and interest rates won't go up enough to negate those lower prices, then you may be on to something. at least you are acknowledging that longterm you want to be buying and not renting ... that is a good move."
ReplyDeleteLance, that's exactly what most of the "bubbleheads" here think.
"At the risk of losing credibility with you, I state the following:
ReplyDeleteHomeownership is a key to retirement planning. One should be able to buy a home, save money, and max out the 401 and IRA simultaneously."
Investor,
Fair enough. Now, my question to you:
What house price multiple to income is consistent with being able to do these things? Would you say the housing payment should be about 30% of someone's take home pay (after taking out taxes and 401k)?
Keith asked:
ReplyDelete"Lance, I asked very specfic question about three major fundamentals in the DC housing market, which all happen to be bad. In addition, I asked you for your actual beliefs about what will happen.
Lance, how many months of inventories do you believe there have to be to make prices fall?"
I really have things to do ... and need to get going .. but will attempt to give you short answers despite you "tone" with me in the last few posts.
you said:
"The three fundamentals of real estate are:
Prince/income ratios: Generally the rule of thumb is approx. housing price should be no more than 7 times median personal income.
Inventories: Above 6 months is dangerous. According to the latest article, it's 7 months.
Price/rent ratios: The price-to-rent multiple is generally 15, and shouldn't be much over 20. In DC, it's 26."
Okay, now that I am looking over your fundamentals ... I am seeing the disconnect between our ways of viewing this situation. Yes, I can try to answer these ... for example I can say that 7 times median personal income leaves for a lot of houses/condos that are out there to be bought by even those earing less than average. For example 7 times $50,000 is $350,000 ... That person can buy a $300,000 condo and have room to spare for condo fees etc. I can also say that based on your inventory stats that this means people will either end up taking their houses off the market or lowering their prices --- both of which are good viable alternatives based on one's circumstances and desired outcomes. For example, someone like Va_Investor will just wait to sell of any properties till he can get a good price for them. As for the price to rent ratio ... I can say that perhaps it is so high is that people are so fearful of prices getting even higher than they are longterm that they are willing to pay more of a premium than usual for the opportunity to lock-in today's monthly costs. (And remember the key is monthly costs not total cost of a house 'cause a few percentage points increase in mortgage can up those costs significantly.)
BUT, what I have been trying to get across to you is that when you look at it as you have been looking at it, you are viewing it as an investment and not an expense. Your other post justifying why it might be better to rent for now and buy later is IMHO the corret way to view it. We are afterall looking at house to fill housing needs ... not at how to make money. Sometimes these coincide as Va-Investor and I have been illustrating, but sometimes they don't. For example, I agree with him/her that it would make no sense to buy an investment property today except under truly special circumstances. And I think Va-Investor would agree with me that today's high prices should not act as a bar to buying one's housing rather then renting it dependent of course under one's own unique circumstances and belief as to where monthly housing costs are going vis-a-vis renting vs. buying.
Keith,
ReplyDeleteIt is impossible to answer your question because the percentage of take-home pay that can/should be spent on housing is so variable.
For example: Do you want/need to drive a new car every 2 years; do you want/need to buy $1,000 suits; do you want/need to eat at Morton's every Friday?
See my point? We sacrificed early on to get a house. We were way over the recommended ratio's. It is an individual decision. Add up your fixed expenses and see what is left.
Keith asked:
ReplyDelete"Finally, Investor and Lance, what do you think will happen to DC housing prices between now and 2009? Be as specific as you like."
Metro area in general -- overall stagnate/down for next 18 to 24 months ... then beginning to rise again at "normal rates" ... (and note that I am talking "sales" prices here ... NOT monthly housing costs ... for example, I believe that for the next couple of years we will be seeing increasing interest rates meaning that while house prices may stagnate or go down, monthly payments will be going up substantially. I don't know where interest rates will go after a couple of years ... I think that truly depends on who is in the White House after the next election.)
the District itself - marginal/transistional neighborhoods will continue to see real increases in value which will be reflected in their prices in concert with other factors such as economic growth for the metro area and interest rates. In other words, because of increased traffic in the suburbs, changing demographics in the older "outer burbs" as characterized by group houses with multiple cars out front, and a general increase in interest by younger (and empty-nest) Americans to live a more cultural urban/European-like life, the value of living "downtown" ... adn the subsequent "premium" willing to be paid by said groups will continue to increase. This will of course be tempered by general economic factors ... but under it all, WILL be a real increase in value. I can't really predict much for the suburbs other than that some of them such as Bethesda and Arlington and Alexandria will benefit from some of the same "urban-living experience" that the District will benefit from. Though note that most of these places (Silver Spring being a notable exception) will have already started off "high" on the scale of expense-cheap ... so, the REAL valuation accretion won't be as pronounced as in the District where we were starting from so low on that scale. Other burbs ... the transitional ones that are finding themselves transitioning from "solid middle class" to "group home haven" may find themselves losing real value as the middleclass heads either in to town (and Arlington, etc.) or further out into the ex-urbs. And this is a long term trend I see here (i.e., 10, 15, 20 years?) The ex-hurbs will probably see some price decreases for the shortterm as rising housing stocks cause builders to lower prices to sell everything "in the pipeline".
BUT all this has to be viewed against the general economic fundamentals for the region. I believe that these are strong very strong because the US government is in a unique position today to exert its influence throughout the world, and everything making that possible (from technology to policy) is right here in this area. I also believe that the moneys spent on Iraq (and tax cuts) will cause us to enter an inflationary period similar to that which we experienced in the late 70s/early 80s when mortgage rates approached 20% ...
dc_too said:
ReplyDelete"Lance, you still haven't answered Keith's questions."
Yes, and that is because I haven't given you the answers/validation you were looking for. I'm sure you'll be okay ... for a few years anyway!
dc-Too said:
ReplyDelete"Look forward to meeting you on the courthouse steps, Lance. Don't bother bringing two sets of your keys, I'll be changing the locks anyway.'
This so perfectly illustrates the attitude of those of you that give a bad name to bubbleheads ... the underlying veiled threat that you are going to be stealing homeowners houses. It's not a pretty attitude. Learn to earn your own home rather than coveting your neighbor's.
dc_too said:
ReplyDelete"As the easy money starts to dry up, there will be ample opportunity for all to "earn their own home." Be patient, Lance. You'll see."
IMHO you are confusing modern means of determing credit worthiness and ability to repay with "easy money". There was a time when 20% downpayments were required because that was the only assurance a lender could have that the loan would be repaid. In today's technology-laden environment where your every purchase and credit transaction is monitored and checked for trends, all it takes is a phone call (or internet linkup) to check to see how credit worthy an applicant is and to see if he has the ability to repay. That is not "easy money" ... that is technology making a lending decision easier and cheaper.
This has nothing to do with the topic, but I noticed that for some of the condos being sold in the area that the land that the complex is built on is not owned by the builder. They only have a lease on the land for a certain amount of time. What happens to the condo owners when the lease runs out?
ReplyDeleteWhat I have taken away from this thread.
ReplyDelete1)When it all comes down to it, it turns out Lance has an I/O loan home he plans to live in long term (his dream house). To cover the cost when the IO resets he is counting on an increase in his salary. This is classic poor planning. Futhermore, he has a (bitter) renter (who has no investment in thier community) living on the property, helping cover his costs.
2) Va-investor acquired his real estate from buing fixer uppers and moving repeatedly. Decent plan a decade ago and it is certainly paying off now. But does anyone remember last summer? Or the year before? Remember all the 'inspections waived'? People were clamoring to buy a house that hadn't even been maintained. Fixers upper were going for full market price - the Post even ran a story about it. That was how manic the market was. People could barely afford the mortgage on a place that was falling down around them.
This comment has been removed by a blog administrator.
ReplyDeleteanon said:
ReplyDelete"1)When it all comes down to it, it turns out Lance has an I/O loan home he plans to live in long term (his dream house). To cover the cost when the IO resets he is counting on an increase in his salary. This is classic poor planning."
I think you missed the part where I said I'd recently changed jobs and am ALREADY earning that extra amount I will need in year 10 to cover the incremental increase in the mortgage ... And that I am thus "9 years ahead of schedule." Besides, if you'd really been following, you would have deduced that within 10 years (time to reset from when loan was taken) it could pretty much have been assumed that my 2 rentals on the property would have been bringing in at least the $1,000 a month more via rent increases to cover the "reset" differential. I.e., even if I'd had no pay increases I'd have still had the extra revenue to cover the I/O reset amount. Failing to see the obvious, I would say you have classic poor planning abilities which seems to be a common denominator amoung the bubbleheads posting here. Live for today, to h@ll with tomorrow! is truly the motto of the bubbleheads.
and anon ... as for "bitter renters" ... again, you have not been following I have been saying. I have repeatedly said there is a time for renting in just about everyone's life. And there is a time for buying. And just like you wouldn't depend on a Hertz Rent a Car for your long term transportation needs, you probably shouldn't be depending on a rental apartment for your long term housing needes. It all comes down to a matter of "expense". And longterm it is much more expensive to rent than it is to buy ... even in today's high priced market. Yes, if you are that good at "timing the market", that you think you'll be able to go in and get your bargain before the other bubbleheads beat you to the punch, or worse yet, interest rates go sky high, then by all means take the chance you are taking. I must admit I am especially leary of the financial abilities of those who have "cashed in" on their homes expecting to go back in and later buy them at a discount. I can't ever imagine gambling with the roof over my head. But then again, I am risk adverse, which is why when the time was right for me, I didn't let high prices stand in my way ... It was just too obvious to me that my chances of hoping on a falling market (i.e., the 50% declines that bubbleheads are cheerleading for), were just too low to risk not being again in a position to get out of the condo and into a house. Good luck to you in "timing the market".
ReplyDeleteExactly - Lance does not understand risk.
ReplyDeleteI am very glad that his job plans worked out. Sometimes things like that can happen. But once gain, counting on a salary increase, especially one that needs to cover a 44% increase is very risky. I guess I am just dissapointed because Lance's entire financial premise for the owning vs. renting was locking in a price for your mortgage that remained constant while inflation made it cheaper and cheaper. And even he is not doing that.
DC_Too said...
ReplyDelete"You're risk averse? What are you doing with a 10 year I/O? Why not get a fixed note, and let the lender take all the risk? If rates fall (ha ha) you can just refinance, and give your lender additional risk, until you own your house, free and clear?
Just curious Lance, what neighborhood do you live in?"
It IS fixed ... 5% ... it goes to a 20 yr amortization at the 10 yr mark ... meaning 44% higher payments then than now. (I.e., I start paying off principal then ... and it is paid off in 20 yrs .. or the yr 30 mark from when I took the loan.) Of course, if rates drop I can renegotiate or go elsewhere. (I have seller ... financing ... it's part of what I was able to negotiate.) Officially Dupont Circle neighborhood ... but just as close to U & 14th Street. I think the area has a lot of potential because it is just at the edge of gentrified/not-quite gentrified ... and I am on the gentrified side.
This comment has been removed by a blog administrator.
ReplyDeleteanon,
ReplyDelete"I am very glad that his job plans worked out. Sometimes things like that can happen. But once gain, counting on a salary increase, especially one that needs to cover a 44% increase is very risky. I guess I am just dissapointed because Lance's entire financial premise for the owning vs. renting was locking in a price for your mortgage that remained constant while inflation made it cheaper and cheaper. And even he is not doing that."
again, we each must work out our own strategy for what is best for us ... mine was that I wanted my mortgage covered ... And, as i've before, my two rentals in the property currently cover the entire mortgage ... and given the rent increases i will collect as the years go by, they will continue to cover the entire mortgage (and more) when i reach year 10 and the mortgage resets. in the meantime (like yrs 5 through 10) i can just bank the difference .. (That was why I orginally refered to "earnings" ... and not "salary".) Yes, I am fortunate that my recent salary increase has already covered the difference, but in reality, I should hope that in 10 years I should be able to earn some $1,000 a month more ... I.e., $12,000 a year .. even at worst case, let's say I should at least be earning $20,000 a year more in 10 years ... Even if most of it is due to inflation and not real earnings increase! This was really a no-brainer for me ... even if I hadn't had the rentals in the unit.
I understand that Lance has a plan all worked out. It seems like a good one on paper.
ReplyDeleteBut does anyone, ever buy a home thinking that someday they won't be able to pay the mortgage? Everyone counts on something, whether it is a pay increase, or inheritance, or whatever. If for any reason, he has to leave that house in the next 10 years, if the house had depreciated AT ALL, he would have to bring $ to the table in order to sell. Maybe that it not a problem for him, but for many it would be. In fact, if the house had only mainanted its value then all the $ he has put into it thus far is gone too.
Most people don't count on losing a job, sickness, being unemployed for a long time, losing renters for a long time, car repairs, home repairs, etc. But foreclosures happen. That means that for many everything didn't just work out in the end....
anon 3:37,
ReplyDeleteOne thing can be predicted here. Based on your comment, you will never own. I bet you have a book full of excuses/reasons.
yes anon 337, you don't understand that nothing in life is EVER sure ... now, as I have said, i am fiscally conservative and don't believe in "gambling" ... please don't confuse "gambling" with looking around you and making your best guess as to future events (and how they will impact you) with "gambling". "gambling" is looking around you and seeing all the fundamentals such as economic growth and inflation are there to increase housing costs (i.e., monthly mortgage payments), and deciding you're going to bank on the 5% chance that the economy is going to collapse and let you get that condo you've been wanting for a 50% discount before some other bubblehead gets it first and/or you end up in a bidding war for it. and yes, i realize that it IS possible for one person's "gambling" to be another's "reasonable estimation as to probability" ... and that is what we are on here for .. .i.e. to discuss what is reasonable out there and what is not ... NOW, you're bringing up the possibility of everything and anything that can happen to you ... well, unless you are the worst worker in the world (and not entrenched in a government job that you can't be fired from), why should you worry about that which is improbable? any one of us can get laid off or get sick, etc. i personally was laid off from my job of 11 years only 2 1/2 months after buying the house last year! did i expect this? no, of course not. did i deal with it? yes ... and you know what? i ended up with not only 5 months serverence pay, but making some $18,000 a year more because in the new job! (it doesn't pay to stay in one job too long ... you get your big "raises" by switching companies.) in the end, all is well ... actually, "better" than it was. my experience has shown me that whenever one door closes, another opens. change is good ... it is opportunity. PLEASE, for your own good, stop fearing "what may happen" and start looking forward to "what may change" as this is what brings you opportunities! Nothing in life is guaranteed ... not for anyone ... under any circumstances.
ReplyDeleteActually, fear is what prevents people from taking risks. It is when the fear is unreasonable (as in the case of anon 3:37) that success is undermined.
ReplyDeleteI hope that all my tenants are afraid! I hate turnover.
Anyone follow the Charlotte, NC market? I was looking at some 2br condos on Lake Norman about a year and a half ago that were selling for about $125k. I just looked on-line and see a couple for sale and a couple under contract for just over $200k. I did not think that charlotte was participating in the run up in prices. Is this a lake thing, or is the rest of charlotte jumping up in price too?
ReplyDeletegodot,
ReplyDeleteDon't know about Charlotte, but 75% of what I own is waterfront and I have seen some good run-ups.
The Boomers are buying second homes.
va_investor and lance,
ReplyDeleteI am in my 20s. And I certainly plan to own one day. I am not saying that the reasons listed above are reasons not to own, they are simply reasons to plan, to keep assets liquid, to not over extend yourself, and to be very knowledgable about the inherent risks of sophisticated financials tools (such as I/O financing).
A lot of folks just aren't counting doing this stuff. An interesting book about this is The Two Income Trap. It talks about how two income families are declaring bankruptcies because couples based their finances on two incomes. When one loses their job, they can't carry the load and in comes cases declare bankruptcy.
I am not controlled by fear. In fact, by being aware of the above, I feel more confident about my financial future because I am 'expecting the unexpected' and planning for it accordingly. That said, I appreciate your concern for folks like myself.
"Any feedback on my posting guys? Thank you!"
ReplyDeleteNah, you pretty much nailed it. Watch those who tell you that condos will be hurt, but townhouses and single family homes will be ok. If you took econ 101 you learn that a substitutes rise and fall with the primary item. They may not fall buy the same percentage, but if condos drop 30%, you can expect townhomes and sfh's to follow a similar pattern.
Also, don't listen to those who say "my place is in DC or Arlington, so it won't be hurt...it is the ones in the suburbs that will be hurt." Also bunk, if you have watched this market, then you know that percentage gains in ashburn have been similar to those in arlington - they just started at different levels. The inventories seem to be rising in lockstep, so you can expect that the price declines, which are just starting, will also follow the same pattern.
You would think that I would be selling my last place after having said all of this...I am not. Crazy things happen (like the last 5 years) so I will hold on to one as a hedge against the remote possibiliy of higher prices
Godot,
ReplyDeleteDidn't your transaction costs and taxes equal or exceed any projected downturn?
"Didn't your transaction costs and taxes equal or exceed any projected downturn? "
ReplyDeletePoint well taken. I made out well on one place because I lived in it for over two years, but the other had substantial costs even though I sold it FSBO. To me it is about opportunity cost...if I have a cleaner slate once the downturn takes place, which I understand is not a guarantee, then I will load up on house or houses at that time. I am of the belief that this is the "sell high" portion of the buy low sell high cycle. The biggest issue that I am facing is finding the patience to wait out the downturn before buying again - This could take years. I will also be willing to start buying again if the rent to mortgage ratio gets in line by higher rents and higher national income. Plan B will be to move somewhere that this is the case...I like DC, but I am not in love with it. Are you still buying properties? Prices must seem ridiculous to you if you own some at pre 2001 prices...
godot,
ReplyDeleteI bought a couple of places last year at absolute steals. I 1031'd into them, so no new money was invested.
Prior to that, I last bought in2002 at a foreclosure auction. I have 12-14 properties. I put a contract on some land last weekend.
I will and am buying if the price is right. My longterm plan is to have everything paid for by age 55 and then use the rents to supplement retirement.
Even in this market, it is still possible to buy low and sell high.
My 2 retirement homes are alraedy free and clear. I used 1031's to acquire both.
At present, I plan to leave all the property to my son (now a teenager).
VA,
ReplyDeleteSounds like you got it together...yeah, the one property that I have left, I bought in early 2005 at a steal, and I will hold that beyond retirement. I would like to accumulate several more places, but my better judgment tells me to wait and that there will be a better time.
I have never owned more than 3 places at one time. Have you had any difficulty with mortgage lenders when it comes to financing? Do they require that you offer the free and clear places as collateral? Have you used different lenders or the same ones all of the time? How about down payments…have you had to increase them each time, or has 25% been an acceptable amount?
godot,
ReplyDeleteWow, lot's of questions. We have had at least 6 or 8 properties since our mid-late 20's.
Early on the financing was difficult. We started buying at age 22 and moved every year or two - keeping the old place as a rental. That way we received low-downpayment favorable terms. Several acquisitions were owner-financed ( an excellent way to go).
In our late 20's, we developed a relationship with a small, family-owned bank. I could get a loan in a matter of days with 20 or 25% down.
I did at one-time cross collateralize some of our properties to establish a line of credit to buy foreclosures.
With the advent of credit scores, plus our income and job history, financing has been a piece of cake. I refied 4 properties at once thru a national lender and did not have to produce one piece of paper (3 yrs ago).
I now have checkbook lines-of-credit on most of my places so that I can pay cash if needed for a great deal.
I have never "had" to put more than 20% down and often only 5%. I usually put 25 -30% down or more if it is a 1031.
Thanks for the info...I would have thought that mortgage co's would want a substantial downpayment if it was not an owner occupied residence.
ReplyDeleteVa_Investor,
ReplyDeleteWay to go! I like your thinking ... and proven success!
Yes, what a horrible, terrible, no good very bad Arlington real estate market
ReplyDeletehttp://sungazette.net/articles/2006/07/16/arlington/news/nws906a.txt
Anonymous posted a lame article that says nothing about Arlinton real estate fundamentals. Pretty desperate.
ReplyDeleteI don't think a young person could implement Investor's plan in the DC area today. I do think a young person could do it in many other areas, though.
Investor, could you provide some information on your first house payments, and what the rents were on your first few homes when you started?
We could then compare this to payments and rents today, and see if the plan would work in the present market.
Of course, Investor himself says he hasn't bought much, especially since 2002. So he likely agrees with me.
I think Investor is a bubblehead, actually, who's had a strong reaction to some of the crazier bubbleheads on the board. But really, Investor, Lance is crazy the other way, and you just gotta face that.
Keith,
ReplyDeleteYou'd be surprized at some of the numbers.
We bought our first house in 1981. This was in Cinncinati - very cheap living. Our rent had been $275 and our mortgage was $650. Huge increase. Our income was about 30K.
We were transferred to D.C. area 6 mos later. We had bought undermarket and were able to get out without a loss.
Here, we could only afford a one-bedroom condo in a bad area so we rented for 2 yrs. at $400 per month.
We then bought with a one-year arm. Got a fixer in Falls Church for 100K. Our monthly payment doubled to $860.
We bought a rental in the interim in Silver Spring for 78K. Also a fixer (estate sale). Also one year arm. As I recall the rent was about 3/4 of the payment. We looked at plenty of places for around a 100k where the negatives would be 400-500/month. Huge as a ratio.
We were never positive on cash-flow until the early 90's when rates dropped and I was able to refi everything AND raise rents.
We, basically, took it on the chin for some years but had plenty of income to cover things.
We always bought well under-market so the negative (after taxes) did not concern me too much.
Cash-flow is vastly improved now as one would expect.
As I have said before, absent a brief window in the late 90's, it has always been impossible (at least for me) to be break-even absent 30-40% down.
Thank you va_investor for your honesty.
ReplyDeleteIt is important for people to understand that it is very difficult to make money with rentals right off the bat. especially without significant cash up front.
Keith,
ReplyDeleteNote though that from a "profit" and a "cash flow" basis, Va_Investor's deficits between what he was renting out for and what they were costing him were not as bad as they seemed from the numbers he quoted ... assuming he knew what he was doing, and I wouldn't doubt that he did. Firstly, when you are renting out an asset such as a house, you are allowed to take a depreciation deduction each year. And since the mid '80s (Reagan's tax changes) that has been accelerated depreciation ... meaning you could write off a fairly large chunk of the basis (i.e., "value") of the house each year. (Basis is what you paid for it minus buying expenses ... Mortgaged vs. Non-mortgaged amounts are not differentiated.) So, assuming he had a good income, he could benefit each year by not paying tax on income that otherwise would have been taxed. And from a cashflow perspective, he could just adjust his exemptions (W4 Form) to reduce tax withholdings on a monthly basis. On a rough basis, I would bet that at least 1/2 (if not much more) of the differential between rents and mortgage costs was reduced because of this tax benefit. Any comments Va Investor?
Lance,
ReplyDeleteRight on regarding the tax aspects. Those who have been around awhile remember when the passive activity loss limitations went into effect in the late 80's.
This caused some heartburn for us until around 93 or 94 when the Real Estate Professional exceptions were created. Our effective tax rate is extremely low and my husband used to claim 20 exemptions to increase the cash flow.
Investor,
ReplyDeleteOn the 275 to 650 rent increase in Cincinnati: Were you renting a house before?
I.e., was your rental hedonically similar to the house you bought? I think this is important.
For instance, your housing costs doubled plus some in DC in the 1980s, but you went from a 1 bedroom condo to a house in a decent suburb.
Frankly, with the amount of saving you did, especially during your neg cash flow years, it sounds like you'd be rich today either way, either through housing or the stock market.
Arguably, the leverage you can bring to housing, along with your willingness and ability to spot "deal," may have made real estate better.
Question: When you say "undermarket," are you talking about houses that are going for less than the houses around them?
Keith,
ReplyDeleteIn Cinn., we went from an apartment to a house. I don't think the house rent would have been that much more.
By "undermarket" I mean less than the comps - at least 10%. We wanted/needed to be able to get out if necessary. We didn't have much money back then and looked long and hard for the right deal.
Later on, I learned about foreclosures and started buying those as our rentals.
Does anyone reading this blog really believe that the average homeowner in DC or Northern Virginia is anywhere near as advanced as Va Investor or Lance? (This is not a facetious dig at VAI or Lance, btw).
ReplyDeleteNo, of course not. The average reader of this blog works menial jobs and has minimum savings. The average reader also has only the most basic understanding of finances and investing. The average reader would much rather pout and rant than do anything to improve his/her lot in life.
ReplyDeleteNo, but many on this board are.
ReplyDeletebtw - va_investor has the wisdom of experience, lance less so.